By Oregon Office of Economic Analysis
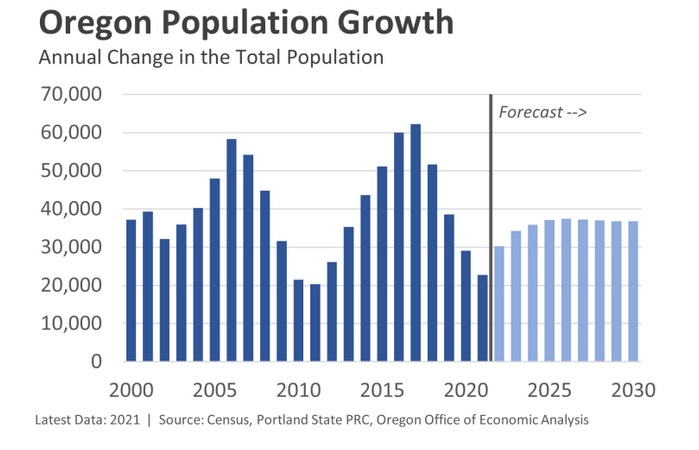
If inflation is the key macroeconomic issue to watch, population growth is the key Oregon issue. The state’s ability to attract and retain working-age households is the primary reason why Oregon’s economy grows faster than the nation over the entire business cycle. The inflows of young, skilled migrants allow local businesses to hire and expand at a faster face due to the growth in the local labor force. Given deaths now outnumber births statewide, Oregon’s population growth will come entirely from net migration.
Migration is pro-cyclical. People move less in bad economic times when job opportunities are harder to come by but move more in good economic times as they chase those more-plentiful opportunities. As such, Oregon’s population growth slowed in 2020 and slowed further in 2021. Expectations are for the upcoming 2022 population estimates to show a rebound. Portland State’s Population Research Center is set to release their 2022 population estimates in November, while the Census Bureau’s estimates will be released in December.
The two primary reasons why our office forecasts a rebound in population growth is that this is the typical pattern seen over the business cycle and the fact that the number of surrendered driver licenses at Oregon DMVs remains strong. Surrendered licenses have historically been the best leading indicator for migration as when one moves to a new state, she has to turn in, or surrender her license from her previous state in order to get a license from her new state. As such, surrendered licenses are a good measure for in-migration into the state. The data point toward the expected rebound in migration to Oregon. This data was disrupted by the pandemic due to shutdowns and a period of appointment-only time at the DMVs, but encouragingly the underlying trend in the past 6-9 months is still higher than the pre-pandemic trend. One qualifier is that Oregon DMVs did get new software during the pandemic, which presents the possibility that the recent data is not perfectly compatible with the old data. Time will tell.
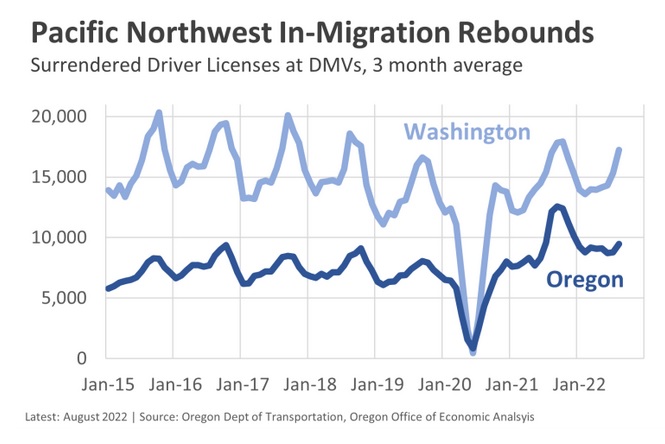
While surrendered licenses are a good measure of in-migration, they do not tell us anything about out-migration. At a basic level what matters most is net migration, or the difference between the inflows and outflows. Net migration to Oregon could remain lower than anticipated if out-migration has picked up to offset the increased in-migration. Not all states regularly publish their surrendered license data, however Washington does. Both Washington’s overall level of surrendered licenses, and those specifically from former Oregonians have returned to pre-pandemic patterns, giving at least some indication that outflows from Oregon are not necessarily higher, and also that the general rebound in migration is across the Pacific Northwest.
That said, research from the Federal Reserve Bank of Cleveland that analyzes credit reports continues to show above-average out-migration from high-cost, large metro areas across the country. This is particularly relevant as our office’s long-standing concern is that housing affordability is a risk to the outlook. If fewer households can afford to live here, and in a world with increased working from home opportunities, the U.S. may continue to see faster growth in lower-cost metros and slower growth in high-cost metros. Included in the Cleveland Fed research is both Portland and Seattle, but no other areas in the Northwest.
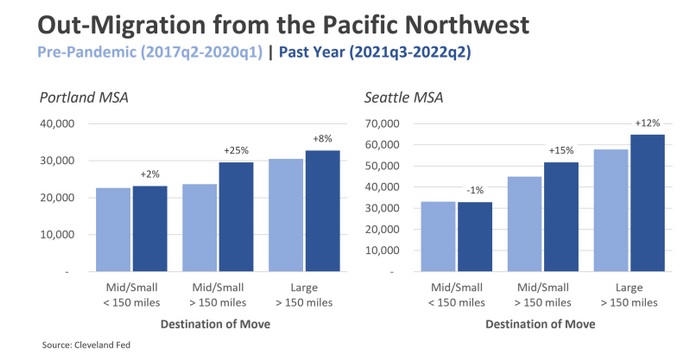
The data show that there are larger increases in outflows from the Portland region to destinations more than 150 miles away. The increases when compared to pre-pandemic patterns are largest to small and medium sized metros (less than 2 million) and rural areas, although outflows to other large metros is up as well. Seattle’s shift in patterns are primarily to other metro areas more than 150 miles away, while moves to nearby locations are down just a hair.
Bottom Line: So far we only have one real year of population data during the pandemic. We will get the 2022 estimates in the months ahead. It will be important to see if the 2021 patterns of growth, like the out-migration from large urban cores nationwide, and faster population growth in the Intermountain West, etc, continue or start to even out. One year of data is not the be-all and end-all, but 2022 should provide some indications of where population growth is returning to normal, and where it is not.
One final and speculative note. In the 2021 estimates Portland State and Census differed, particularly when it comes to Portland. PSU estimates showed slow, but positive growth. Census showed outright declines, relatively small, but still negative*. It will be interesting to compare and contrast the upcoming 2022 estimates. There is a chance they will once again tell different stories. Possibly even a further slowdown or another year of subdued growth from the PSU estimates while Census shows a rebound. Such a hypothetical would mean a couple of things. First it would mean the actual 2022 population estimates from the different sources would be closer together. However second it would mean the path in which we take to go from 2019 to 2022 would be different and provide different interpretations. Again, I don’t know what the upcoming data will show, but am trying to think through the reasonable possibilities and their implications for the forecast. It is also possible that given all of this, including the lingering effect of the pandemic that we will really need to wait for the 2023 data to have a better read on things.
* The 2021 Census estimates showed population declines in nearly all of the primary (largest) counties in major metro areas. It wasn’t just Portland, San Francisco, and Seattle, but also Atlanta, Dallas, Nashville, and Orlando among others. There is a very clear urban-suburban-rural dynamic to the Census estimates that at times gets boiled down or even forced into a blue state-red state discussion. At this point we only have one year of pandemic population estimates and are about to get a second year of data. It will be interesting and important to see how what this pattern looks like in the new 2022 data and in the years ahead. Some of those discussions may very well be right, but we lack the hard data to say decisively today.

Disclaimer: Articles featured on Oregon Report are the creation, responsibility and opinion of the authoring individual or organization which is featured at the top of every article.