By Oregon Employment Department,
This week we’ve shared the latest unemployment and labor force numbers from June, and job vacancy totals during spring 2021 in Oregon. Oregon’s unemployment rate dropped to 5.6% in June. At any given time during spring 2021, Oregon’s private employers had 98,000 job openings. This makes for a good opportunity to check in on the Beveridge Curve.
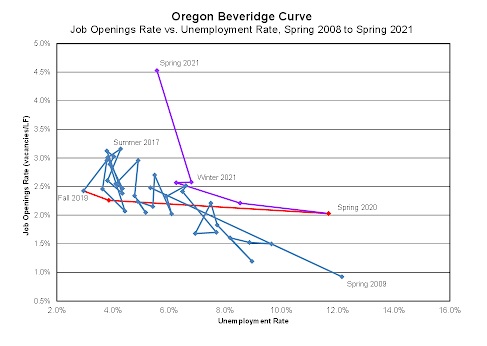
The Beveridge Curve shows the relationship between the job openings rate (vacancies/labor force) and the unemployment rate. Note the labor force includes all those ages 16+ who are either employed, or out of work but are available and able to take a job if offered to them, and have actively sought work in the past four weeks.
At first glance the Beveridge Curve is just a messy squiggle. That squiggly line does generally tend to move in predictable ways though. If it moves out to the right, but stays high, this could mean those who are unemployed are not finding jobs as well, when there seem to be plenty of vacancies. This is where we were in spring 2020.
When the curve moves up and to the left over time, that means the unemployment rate is low, and there’s strong hiring demand relative to the size of the labor force. This appears to be the situation we’re in now. Hiring demand is strong, like it was at its last peak in summer 2017. Now, both Oregon and the nation have recently hit the highest level of job openings on record, while the unemployment rate is relatively low. The U.S. Beveridge Curve looks much like Oregon’s.
What does that mean?
In spring 2020, about 9 out of 10 layoffs at the beginning of the pandemic recession were temporary. Those workers probably expected to get called back to work by their employer once businesses could resume operations, and weren’t likely seeking another job.At the same time, higher-wage earners were more likely to keep their jobs in the downturn, and most households received direct federal fiscal stimulus. That translated to people continuing to buy stuff, and a different mix of stuff (e.g., home goods rather than vacations). That helped keep up the hiring demand to make and/or deliver that stuff, even with higher unemployment.
Now, the Beveridge Curve and the economic picture look quite different. Oregon’s unemployment rate has recovered about five times faster during this recovery than it did following the onset of the Great Recession. We closed many otherwise thriving businesses for public health and safety, to prevent the spread of COVID-19. The first wave of re-opening shows in the dramatic shift of the Beveridge Curve to the left, during what was likely a surge of recalls during the summer and fall of 2020. Unemployment declined significantly, while job vacancies didn’t surge relative to the labor force.
After a pause in both aspects of the Beveridge Curve over the winter — and an economic “freeze” period — unemployment has continued to decline in 2021. Meanwhile, the number of job vacancies skyrocketed.
What is driving our current, really high point on the curve?
As with everything else this year, there are likely many factors at play — at the same time — and it’s hard to tell just how much to attribute to each one. Here’s a (not necessarily exhaustive) list of possibilities:
- There are still some people sitting out the labor force due to COVID-19 concerns. While this has eased from 45,000 in the winter of 2021 down to 32,500 in the spring, that’s still a sizeable number of people not included in the labor force. This could include parents in a bind until in-person school starts up this fall, the immunocompromised, among others. It also shifts the Beveridge Curve a little further to the left than it would otherwise be.
- There’s a lot of pent-up demand to get out, and a lot of pent up savings and/or federal stimulus that went to households throughout 2020 and in spring 2021. More demand for goods, services, and travel means employers need to hire more, pushing up job openings.
- Nationally, we know that the quits rate has recently been at the highest point we’ve ever seen. If someone quits their job, it creates a job opening to replace them.
- Retirements are likely on the upswing again. As with a quit, when someone retires, it creates a replacement opening…and also means one less person in the labor force looking for work.
- Are employers also doing some “preemptive posting?” If you already know it’s going to be hard to hire in the coming months, do you get those upcoming job openings out there now to try to build a candidate pool?
- What about enhanced unemployment benefits? We know that in winter 2021, on average, regular unemployment benefits were full wage replacement (about 103%) relative to the earnings of what those receiving benefits were earning at their pre-pandemic jobs. From January to June, the number of Oregonians receiving any kind of ongoing unemployment benefits fell by 30%. The resumption of job search registration and upcoming re-implementation of active work search requirements in July should diminish any remaining labor force disincentives related to benefits.
The Beveridge Curve shows a current labor market dynamic in Oregon that continues to be incredibly competitive for hiring. Employers have already added 57,800 jobs in the first half of this year. Leading up to the pandemic, it took Oregon 22 months to add about that many jobs. Rapid hiring and barriers holding some out of the labor force are contributing to ongoing labor shortages.
More information about Oregon’s job vacancy survey is available at https://www.qualityinfo.org/pubs. Questions about Oregon’s Beveridge Curve can be sent to [email protected].

Disclaimer: Articles featured on Oregon Report are the creation, responsibility and opinion of the authoring individual or organization which is featured at the top of every article.