
By Josh Lehner
Oregon Office of Economic Analysis
We received the national June jobs report. Another very strong month for job gains, and ongoing wage increases. It is encouraging to see these dynamics continue to play out as the labor market recovers from the pandemic. Our office’s forecast has front-loaded the growth this cycle due to the income and spending dynamics, however the risks in a supply-constrained economy are for slower gains and a little bit higher inflation unless the supply side can ramp up quicker and productivity accelerates further. With that said, let’s dig a bit into the latest income data.
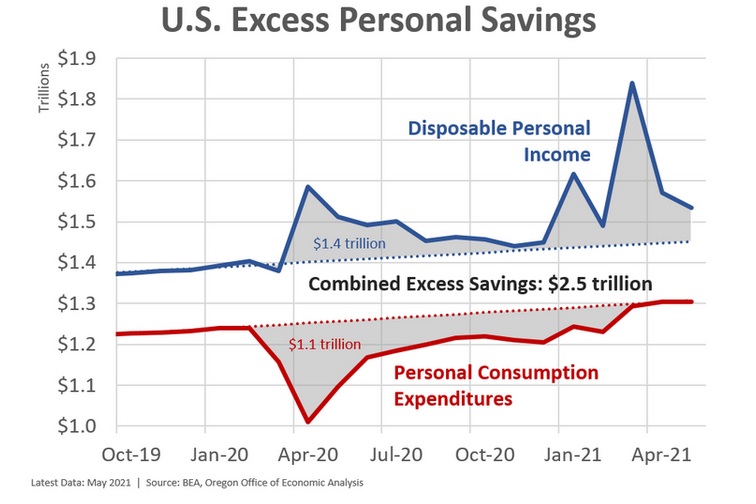
First, just to reiterate, the reason the underlying economic outlook is so bright is this chart. Households have around $2.5 trillion in excess savings, much of it just sitting in bank accounts ready to be spent should they want to. Our advisors indicate that retail deposits in local banks and credit unions show the same patterns locally. Of course the strong incomes are due to the federal policy response. The stated goal with the recovery rebates and enhanced unemployment insurance benefits was to make households financially whole during a global pandemic. At the macro level, a job well done. When you combine the strong income numbers with reduced spending due to both public health restrictions and fearful consumers, it paints a very robust picture of household balance sheets moving forward.
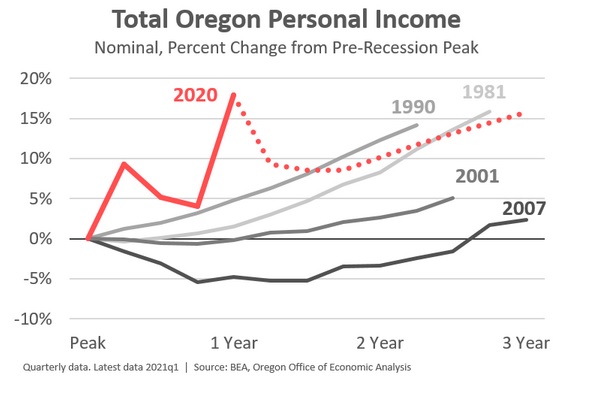
OK, let’s dig into the Oregon numbers now. The next chart shows total personal income in Oregon across recent business cycles. Clearly this cycle is different. Even as the temporary federal aid fades, income is expected to be stronger than in the recent long-lasting, demand-driven cycles following the dotcom and housing busts. Note that the solid lines represent actual data, and the dotted lines are our office’s forecast.
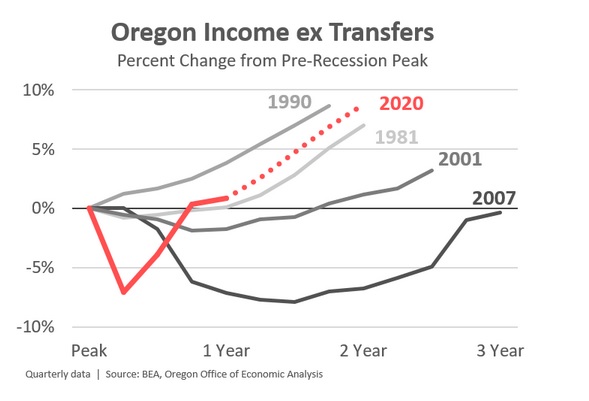
Given we know much of the strong incomes today are due to that federal aid, let’s take a look at the underlying income trends in the economy. Given we went through such a deep recession a year ago, the fact these underlying incomes have bounced back so quickly is a testament to the nature of the shock, and the resiliency of the economy. It should also be noted that we cannot account for the indirect effects of the federal aid as well, as without that the rebound would not be as swift either. Note that this chart also strips out our estimates of the impact of PPP loans for small businesses which do show up in the nonfarm proprietors income numbers.
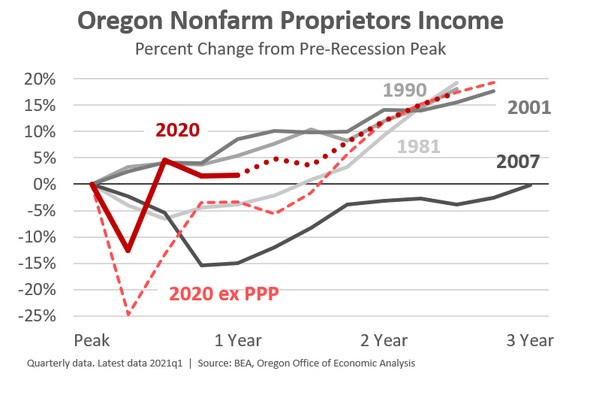
Speaking of proprietors income, the impacts from the PPP are huge — however imperfect the program may be in terms of the rollout and the paperwork. See our office’s previous look at the first round of PPP by industry and county in the state. More importantly, see our dive into the relatively few business closures we have seen during the pandemic and why that is also an encouraging trend for the overall outlook.
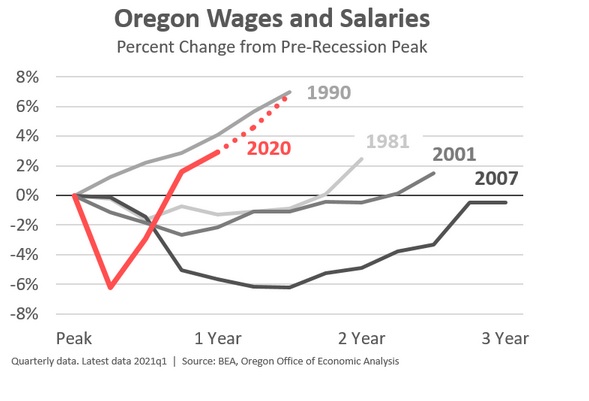
Finally, let’s look at wages in Oregon. Given we still have such a large jobs hole in the labor market, the fact total wages have rebounded this strongly is remarkable. Encouragingly, as we recently detailed, these wage gains are not just an artifact of industry composition, but mostly due to strong, underlying wage growth for workers. This pattern is expected to continue given the bright economic outlook, and a labor market that is tighter than you might think.

Disclaimer: Articles featured on Oregon Report are the creation, responsibility and opinion of the authoring individual or organization which is featured at the top of every article.