By Josh Lehner
Oregon Office of Economic Analysis
What a year it’s been. The good news is that we started the year with the strongest economy we had seen in decades, and we’re ending the year with hope as the vaccines are being delivered. Everything else? Well, I’ve never had less fun.
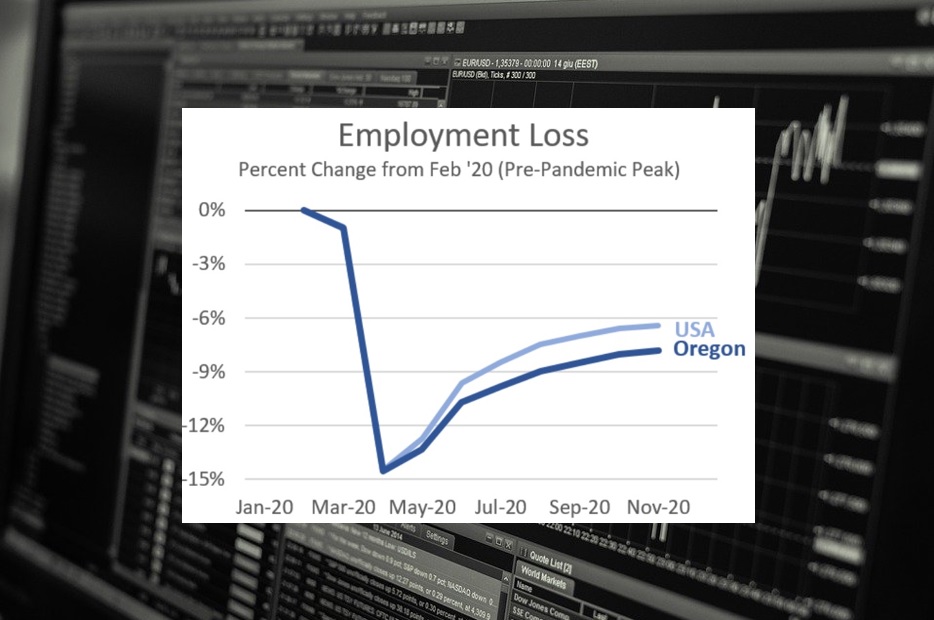
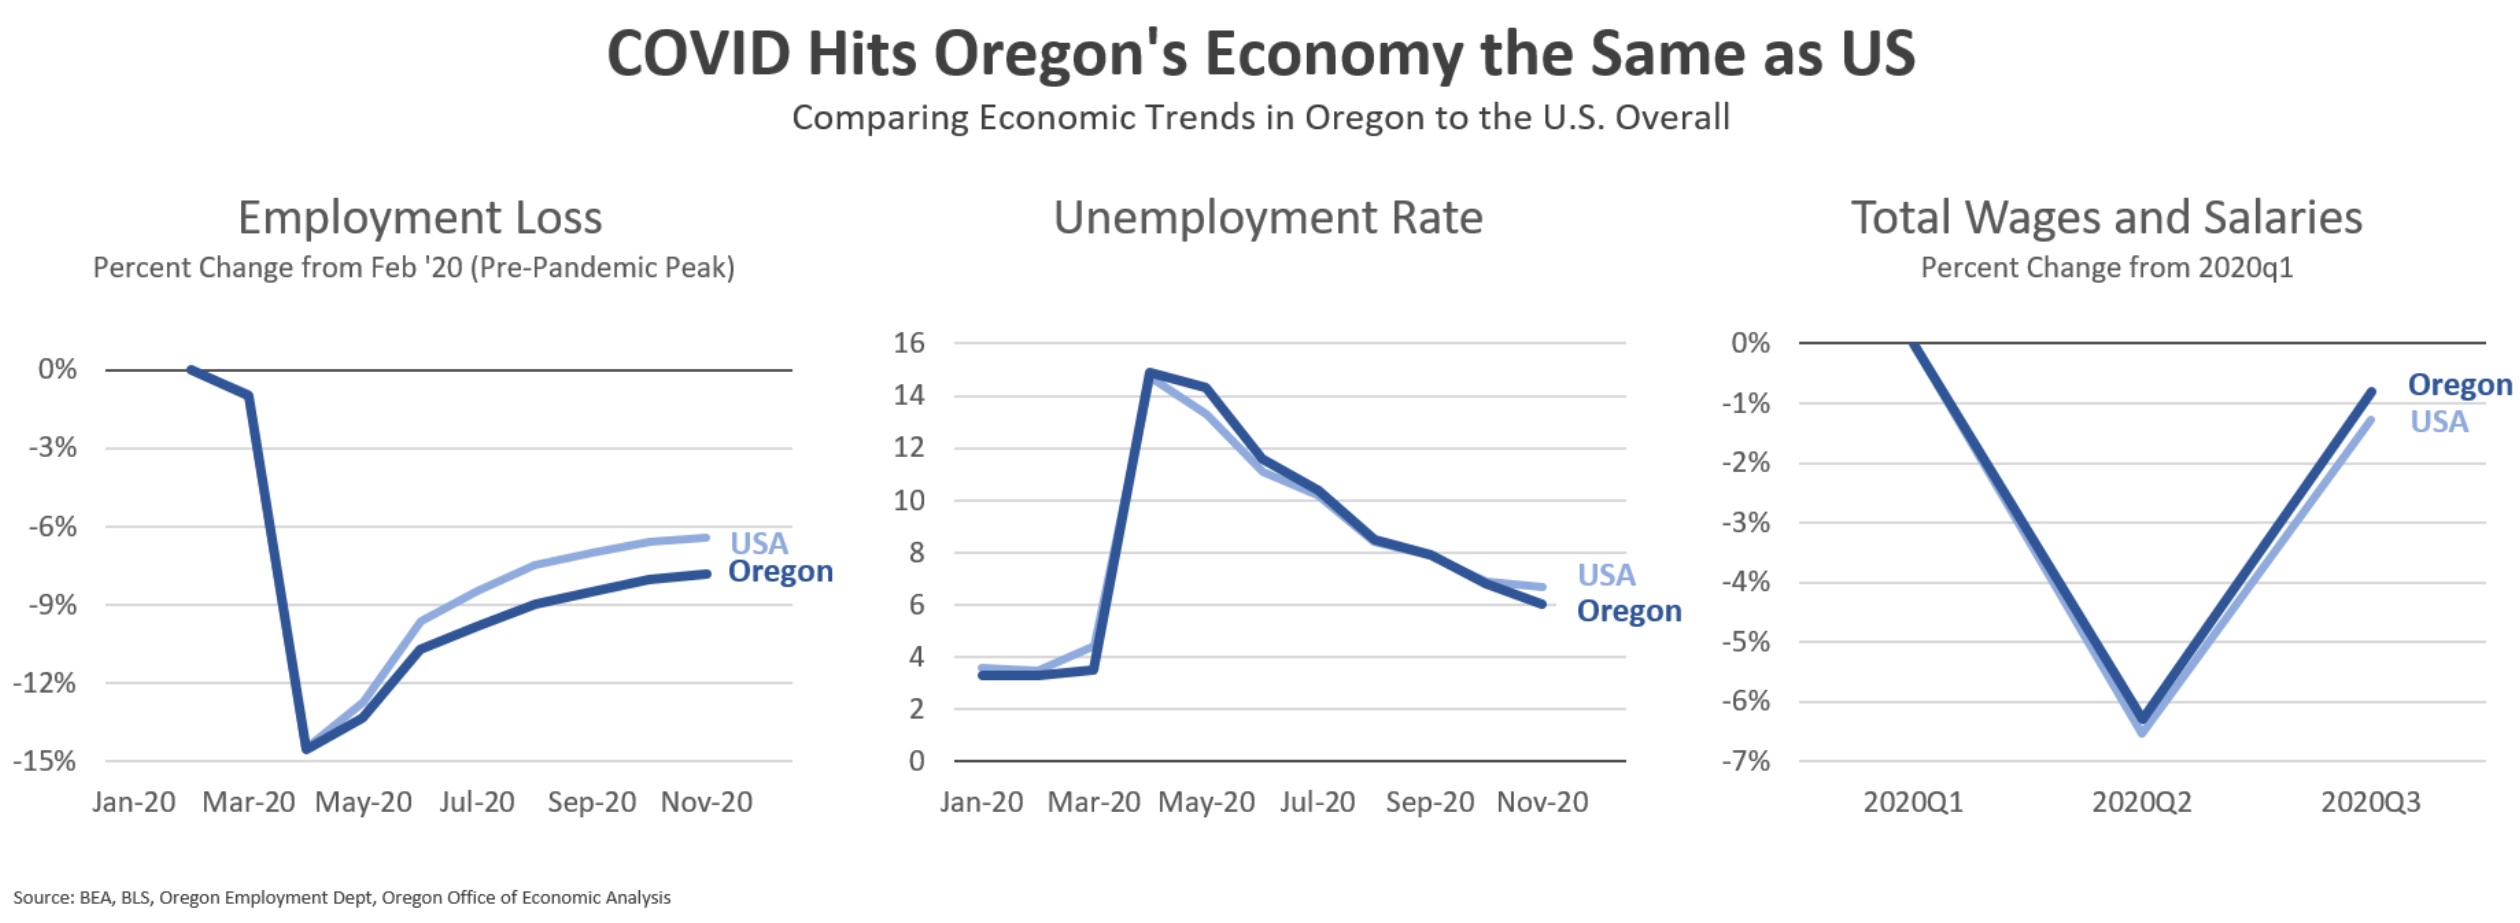
Typically Oregon’s economy is more volatile due to our larger goods producing industries, and migration flows. Both of those are key strengths for Oregon and both are pro-cyclical. That means they grow faster in expansions but fall or slow further in recessions. However the 2020 cycle is a bit different. To date, Oregon has fared economically nearly the same as the nation. We’ve lost a few more jobs but our unemployment rate is a tad lower and our wages have rebounded a bit stronger. This is not the pattern seen in most recessions in the recent decades. That’s why I’m choosing these as the economic graphs of the year.
It’s important to point out that both of those main factors impacting Oregon’s volatility are currently rearing their heads. Our local manufacturing jobs losses are noticeably larger than U.S. losses, likely due to firm-specific or regional supply chain issues rather than the overall business cycle itself. And population growth slowed noticeably through the middle of the year, based on the latest population estimates. (We will come back to both of these discussions in the new year.)
So if our two factors are in play, why aren’t we experiencing a significantly worse recession than the typical state? It could be the nature of the cycle, where the tip of the spear is the in-person consumer services like leisure and hospitality. Those sectors in Oregon are of average size. Additionally this is a global pandemic. Everywhere is being hit at the same time, so there isn’t a lot of variation on the start of the cycle. Similarly the federal policy response has been pretty evenly distributed across the country in terms of recovery rebates, PPP and the like. The expanded UI has a bit more variation based on local job losses. Even so, it is much more likely that local and regional economic variation will show up on the expansion side as we get further away from the synchronicity of the pandemic.
On a related point, much of the OR-US employment gap* today (first chart) is in sectors most impacted by public health restrictions. Oregon has not fully reopened the economy, while some states put in few official restrictions in place. These differences in in-person services, including education, account for around 60 percent of the OR-US gap. On the other hand, the manufacturing gap accounts for around 30 percent of the total. Minor differences in all the other different sectors make up the rest.
Finally, all of this data is preliminary. Take it with a grain of salt. It will be revised in the months and years ahead. But for now this is overall encouraging in the sense that Oregon is not starting from the bottom of the pack like we normally do coming out of a recession. The question is whether we will see the same boost we normally do as the expansion accelerates in a few months. Our office expects this to be the case.
Cheers to 2021 being much better than 2020!
* On a technical note, Oregon does a preliminary benchmark of the employment data every quarter, while the U.S. only does it once a year. What the latest Oregon revisions showed was a slower bounce back in May and June than the initial estimates indicated. That’s when the OR-US gap opens up, and has held steady since. It is possible that future U.S. revisions will be of a similar nature and close some, or all of the OR-US gap. We shall see.

Disclaimer: Articles featured on Oregon Report are the creation, responsibility and opinion of the authoring individual or organization which is featured at the top of every article.