By Josh Lehner,
Oregon Office of Economic Analysis
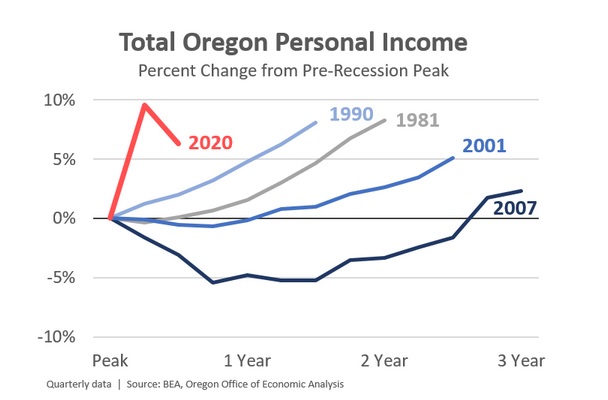
The Bureau of Economic Analysis released state income data for 2020q3. Income data is available monthly at the national level, but only quarterly at the state level, and annually at the county level. Now that we have a few quarters, we can begin to better analyze how incomes and the different sources of income are doing so far in the pandemic. What follows are a few high level charts looking at incomes in Oregon today compared with past recessions.
Like we have talked about using U.S. data, this cycle is different. Personal incomes have risen so far in 2020 despite the pandemic and recession. This increase has meant consumer spending has held up, leading to more economic activity and tax revenue than first feared at the start of the cycle.
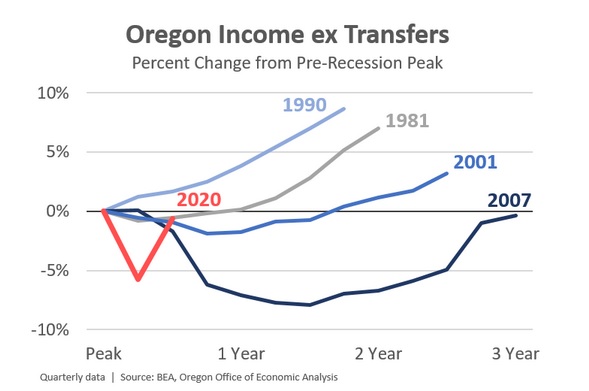
Of course we know the increase in incomes is due to federal aid, namely the CARES Act which included one-time recovery rebates and expanded unemployment insurance benefits to households, and PPP loans/grants to business owners which does show up here in the form of proprietors’ income. It is challenging to remove the PPP impact in the state data since it shows up as proprietors’ and not federal assistance. That said, removing the direct public aid to households is straightforward. The next chart compares underlying economic-related incomes across recent recessions. Today we know income fell nearly as much as it did during the Great Recession but has bounced back quickly as the economy reopened.
The last chart focuses strictly on wages. This shows the same general pattern of a severe recession followed by a strong bounce back. In the third quarter, Oregon jobs were down around 9% but wages only 1%. This speaks directly to the nature of the cycle and how low-wage service sector workers have been the most impacted. High-wage workers have fared relatively well. And those who have kept their job this year continue to see wage gains in line with recent years. This rebound in wages is certainly seen in the state withholding data as well, although that includes bonuses, options, retirement disbursements, and the like.
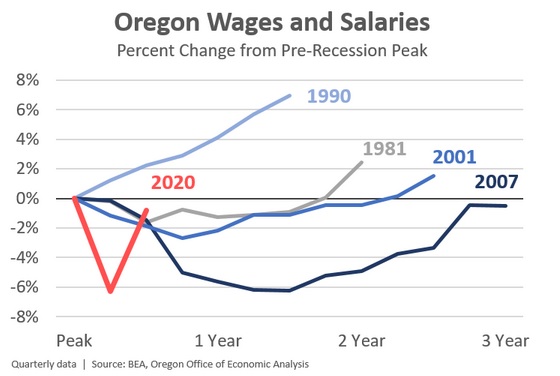
Note: I’m sure you’ve noticed in the charts how 1990 is different as well. At that time, Oregon suffered a mild recession and experienced strong in-migration, keep the overall economy in better shape that during nearly any other business cycle in history.
All told, this cycle is different. The federal aid earlier this year boosted incomes and kept households afloat. Much of this increase in income has been saved at the aggregate level. As households spend more on going out to eat, on vacations, and returning to pre-COVID activities, this savings will propel stronger growth next year. Although, as we discussed yesterday, we know lower-income households have drawn down this savings since the summer when the federal aid lapsed, and is likely the main reason on-time rent payments have fallen in November and December.

Disclaimer: Articles featured on Oregon Report are the creation, responsibility and opinion of the authoring individual or organization which is featured at the top of every article.