By Josh Lehner
Office of Economic Analysis
The U.S. Small Business Administration just released detailed data on the actual Paycheck Protection Program (PPP) loans/grants across the country. Individual business information is now public for loans in excess of $150,000, while general characteristics (amount, zip code, industry) are available for loans of smaller sizes. What follows are a few quick high level cuts of the data to see which industries and regions of the state are getting relatively more, or less in small business assistance. Apologies for the death by bubble chart, but I will conclude with a few relevant thoughts after the graphs.
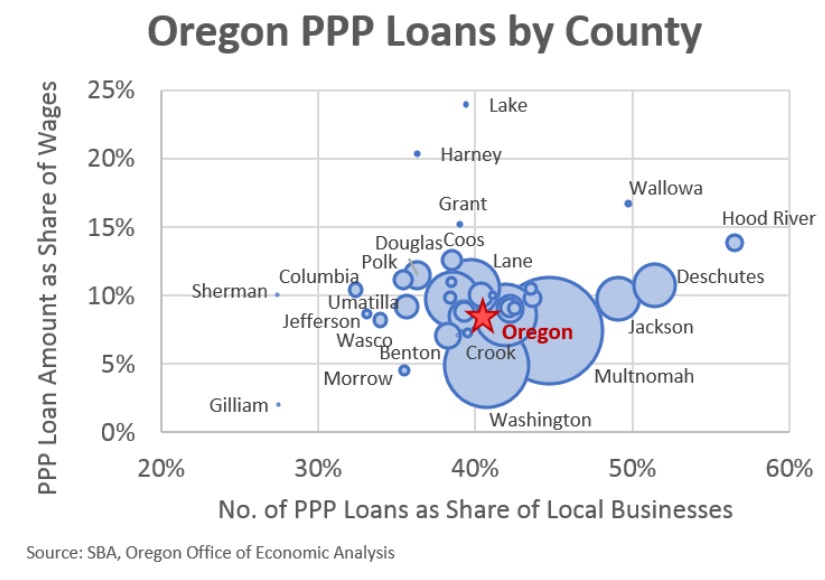
This first look shows PPP loans by county. The horizontal axis measures the share of local businesses that were approved for PPP loans. The vertical axis measures the dollar amount of those loans, relative to local wages. Now, we have imperfect data with some classification and coding issues, but think of these comparisons in broad strokes. Going left to right think of how many firms are being assisted somewhat by the program, and going up and down the relative size and impact on the local economy.
What stands out the most is that a larger share of local firms in places like Deschutes, Hood River, Jackson and Wallowa were approved for PPP loans. We don’t have a good local control for small vs large businesses here, so that may factor in to the higher percentages. In terms of dollar amounts and the potential economic impact, the data indicate very high shares in Grant, Harney, and Lake. In digging into the data a plurality of these PPP loans went to local health providers, raising the countywide figures. Excluding those specific loans, each county was close to the statewide average. On the lower side, Washington County sticks out a bit for the lower percentage of wages, which is most likely due to the presence of a couple large, multinational firms that account for a lot of economic activity and are ineligible for PPP. Additionally, what may also stand out is what’s not shown. PPP loans along the North Coast (Clatsop, Lincoln, Tillamook) are in that cluster of counties just to the right of the statewide average. Given the severity of the local recession on the North Coast, one may have expected to see more PPP loans.
This second chart is a very similar look but instead of counties, we’re looking at high level industries across the state. There is not a ton of variation in terms of the share of firms receiving PPP, but the dollar amounts do vary considerably. No real surprises here that leisure and hospitality and other services are receiving the most PPP loans, given these sectors were the tip of the spear of the recession and those most impacted by shelter in place style policies. They needed the most assistance, and got it. Whether it will be enough to truly weather the storm, only time will tell. Some of the sectors a bit lower down are going to be impacted by the presence of larger businesses, and not as reliant upon small businesses.
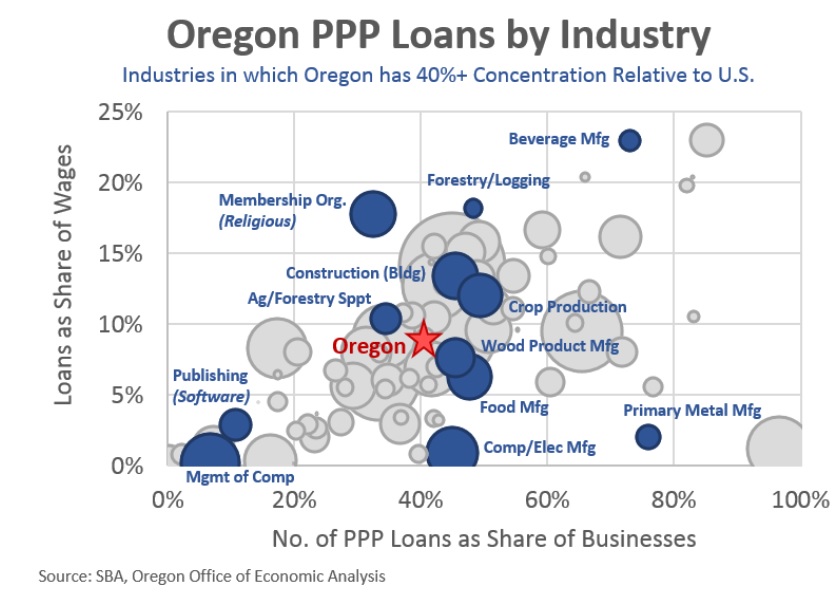
The final chart for today digs a bit deeper into the data and looks at more detailed sector information. Same style chart, but the sectors highlighted in dark blue are industries in which Oregon has a large local concentration relative to the nation. These industries are historical and current economic strengths for the state, even as they may not necessarily be the engines of growth moving forward.
Large parts of the timber and natural resource industry in Oregon were approved for PPP loans. On the other hand sectors like computer and electronic product manufacturing and metal manufacturing saw relatively lower dollar volumes in large part due to the presence of bigger firms that drive a lot of our statewide figures, although it certainly seems that the smaller firms in these industries did receive PPP loans.
Now, the one sector that stood out the most to me was Oregon’s beverage manufacturers. This sector is nearly twice as big locally as it is nationally. In breaking it down it appears that the state’s soda makers, breweries, wineries, and distilleries all received pretty similar numbers, at least in proportion to their size. Sure, a larger share of wineries received some assistance and breweries and distilleries saw a higher share of wages, but overall not a whole lot of differences there. PPP assistance for beverage firms did help some of those county numbers earlier. Places like Clatsop, Deschutes, Hood River, Lincoln, Polk, Wallowa, and Yamhill all saw larger volumes of PPP supporting their local beverage firms. I’ll cheers to that.
Looking forward it will be important to watch the different segments of this sector to help gauge the overall economy. The segments with grocery store distribution have done better recently. Consumers are buying what’s on the shelves. On the other hand, the segments more reliant on on-premise consumption and sales have struggled, to say the least. As discussed the other day, we are getting some mixed signals as to the rebound in restaurant activity and consumer confidence here in Oregon. The viability of the state’s food economy — at least the service portion — will depend upon just how strong that rebound is in the weeks ahead. And remember, that strength, or lack thereof is about public health and the virus. If people do not feel confident in venturing out then firms will struggle more.
A few concluding remarks:
Apparently this needs to be said given some of the online conversation. Don’t dox or knock firms who received PPP. The pandemic was outside of any firm’s control. If you take issue with PPP, address it on the policy side, not the firm side. Don’t try to shame a company for trying to use available programs to stay afloat during a crisis and keep workers employed. Those are things we need!
From an economic outlook perspective, PPP is only helpful to the extent that it keeps firms alive and helps prevent them from closing. So far we know it has helped tens of thousands of small Oregon businesses. The program likely is a key driver behind the stronger employment reports recently. Firms that received PPP said the loans would support more than 600,000 jobs in Oregon. That’s about 1 in 3 private sector jobs in the state. Overall this is to be celebrated.
But given that the program was originally designed to provide 8 weeks of assistance for small businesses, we know that help is now running out. Trying to tease out the relative impacts across regions or industries at the moment feels a bit like a lost cause because we’re still in the middle of the pandemic. The key question isn’t what happened a couple months back, it is what happens next? Will the economy experience another round of layoffs and firm closures or will companies receive further assistance to help tide them through the pandemic?
Disclaimer: Articles featured on Oregon Report are the creation, responsibility and opinion of the authoring individual or organization which is featured at the top of every article.


