By Josh Lehner
Oregon Office of Economic Analysis,
I have a round-up of the latest economic data and our office’s thinking on the outlook.
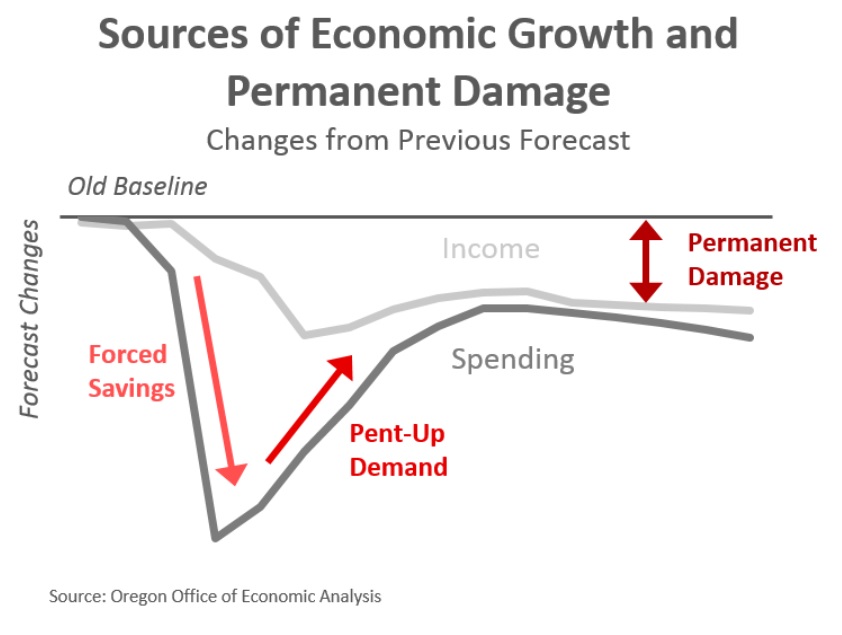
First, let’s talk about near-term sources of economic growth. I think most people have a good intuition on this, but our office is working to articulate it better as we develop the upcoming forecast. Much of the initial rebound in growth our office is expecting later this year is due to pent-up demand. The primary driver here is the forced savings we are seeing today. Households — particularly higher-income households — simply cannot spend as much money as they would like, or at least as much as they normally do. Stores and restaurants are shut down, or offer limited services. Even in this time of financial turmoil and stress for millions of workers, the savings rate is skyrocketing overall. To this point, this morning’s data release shows that U.S. incomes dropped 2% in March but spending declined 7.5%. Savings increased considerably.
As the health situation continues to improve, and social distancing restrictions begin to lift, some of this forced savings will be unleashed in the form of pent-up demand. Households will go to stores and out to eat more. Businesses will need to restock inventories, producing positive knock-on effects across the supply chain and the like. However this recovery will be incomplete for two reasons. One is that even as restrictions begin to lift, the threat of the virus remains real. Society will not return to normal. Consumers will remain hesitant, at least until there is a widely available medical treatment. The second reason for an incomplete recovery overall is the amount of permanent damage in the economy. Spending will eventually revert not to the previous level of spending, but to current income (or current permanent income). So as the economic damage mounts, and jobs and incomes remain lower, then the path of consumer spending will also remain lower than believed before the virus hit.
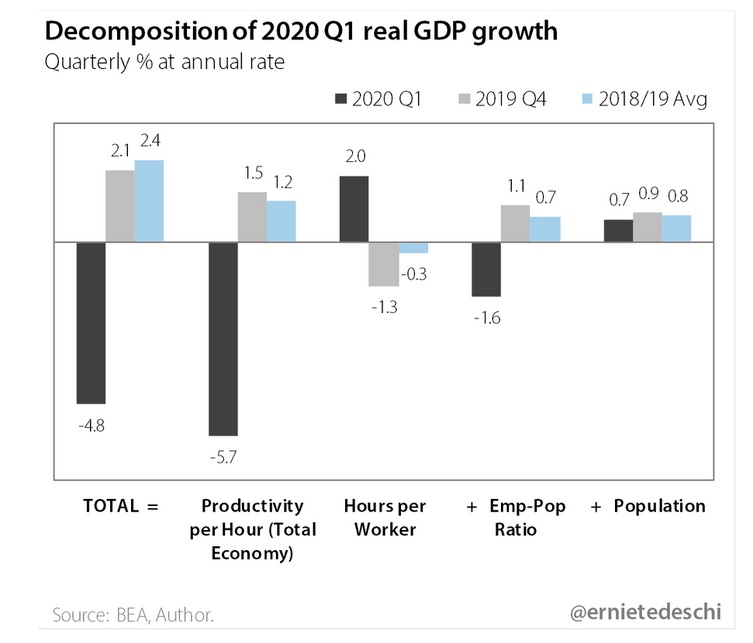
This week also brought our first look at GDP in the first quarter of 2020. As expected, it was ugly. GDP contracted nearly 5% last quarter, on an annualized basis. However we know that January and February were pretty good months and that social distancing really only went into effect in March. So to get such a large decline for the quarter overall, that means the drop in economic activity in March was massive. The full impact will show up in the second quarter data and will set all sorts of bad economic records. That said, as noted above, we do expect pent-up demand to drive growth in the second half of the year.
Now, one item that stood out in the details of the GDP report was the decline in productivity. Economist Ernie Tedeschi posted the following chart on Twitter the other day. Now, productivity declines are bad for economic growth and living standards, particularly over the long run. That said, I wouldn’t harp too much on it today given the circumstances we find ourselves in, even if it remains an issue to watch in the coming quarters.
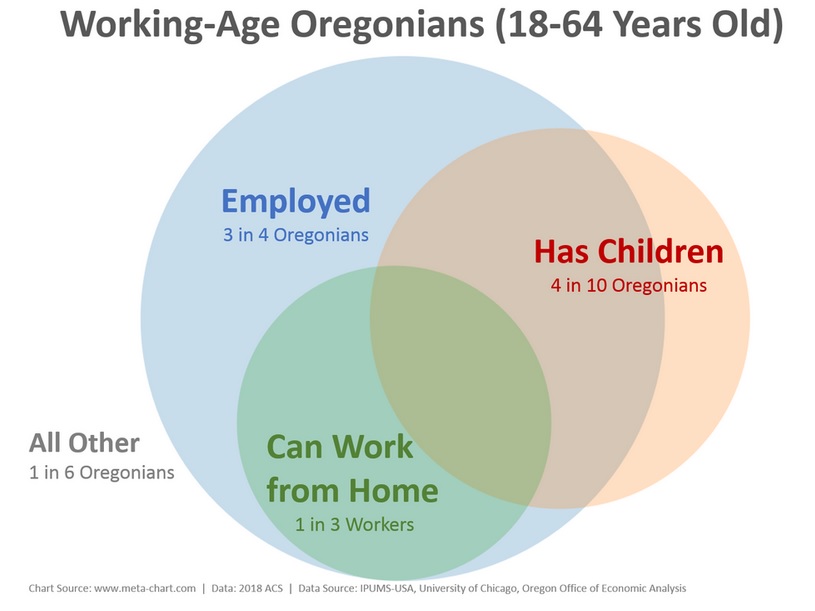
What the decline in productivity really made me think of is how working from home and schools being closed impact our daily lives. This is something I touched on last week during the presentation for the Bend Chamber of Commerce. The following Venn diagram below is an updated and simplified version of one shown here on the site previously. While social distancing impacts us, it does vary based upon our life circumstances like our line of work, our family situation, and the like. We are all trying to figure this out as we go.

Disclaimer: Articles featured on Oregon Report are the creation, responsibility and opinion of the authoring individual or organization which is featured at the top of every article.