
Josh Lehner
Oregon Economic Analysis Office
The beer industry’s slowdown and rising number of closures continues to draw attention. Both Andre Meunier in The Oregonian and Jason Notte in Portland Monthly have really good, local articles in recent weeks. In talking with them and getting updated OLCC data, I have been digging into the latest trends. Over the summer I want to highlight a few of the findings in an occasional series. First up is a look at economic dynamism, or the number of startups and closures.
The low startup rate across the economy has researchers worried. Long-run economic growth typically comes from new ideas and innovations that improve efficiencies and raise productivity. For a variety of reasons, new companies are usually best able to bring these innovations to market. The concern is that without more startups, productivity will grow slowly, keeping a lid on wages and overall economic growth.
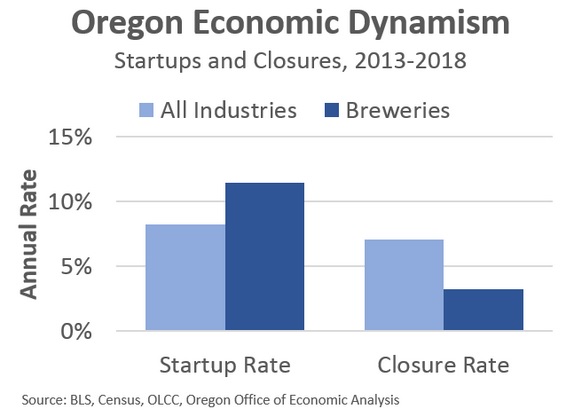
Beer is clearly one industry that has bucked the startup trend. However if we look at economic dynamism overall — both the number of startups and the number of closures — beer really isn’t all that different than the rest of the economy. And while we celebrate startups and their innovations, the creative destruction process really is about both ends of the pipe. The closure of less productive, or less responsive firms to changes in the market is an important component to economic growth and productivity. Of course closures, or failures, are terrible for workers, so having adequate training, job placement, and safety net programs is needed.

Now, the fact that economic dynamism is the same in the beer industry as in the typical industry may be surprising. But this can be misleading and due to offsetting factors that we already knew about. The beer industry’s startup rate in Oregon is 40% higher than the economy overall while the closure rate is half that of the rest of the economy. So, on net the overall dynamism is similar but the composition completely different. The question here is how long can these differences last?
The next chart turns these rates into actual brewery counts. Over the past 5 years Oregon has seen 136 new breweries start producing beer, while 40 have ceased operations. On net, Oregon has added nearly 100 breweries in just the past handful of years.*

The beer industry changes seen in every corner of the state is one item that stood out to me. I’m of two minds here. On one hand, every region has seen strong growth in the number of breweries and has also experienced churn. On the other hand, the regional variations are interesting to note as well.
The Portland area is the most dynamic in the state, even in recent years. But who knew that Southwestern Oregon (Coos, Curry, Douglas) has effectively matched the growth and dynamism of Portland over the past 5 years? Or that the suburbs experienced stronger growth and more dynamism than Portland proper? Click here for county-by-county data on startups and closures. Note that the U.S. is off the chart below in large part due to most states playing catch up to Oregon. The industry is clearly spreading out and is no longer confined to a few beer hotspots.

Some final thoughts.
The big question moving forward is to what extent can this continue. Obviously it is hard to say. There are variations across industries, but rarely do we see extreme outliers persist indefinitely outside of monopolies or the like. Specifically I am watching the brewery closure rate. I suspect it cannot remain half that of the overall economy forever. But to get more closures, a few other dominoes need to fall.
In terms of trying to think through the dynamics of a potential bubble and its bursting, I’d first look for market segment saturation (craft beer as % of total beer, beer sales per adult, etc). Next I’d watch the number of startups into that saturated market. After that I’d look for increased price competition as firms struggle to get their slice of the pie. Now, even in a healthy market all of these dynamics are at play every day for individual firms trying to maintain or growth their marketshare. But these dynamics, to me, are some of the key trends to watch for the industry overall.
Now, most of the post above, and the way we typically talk about the beer industry is all based on the number of breweries. What really matters is the volume of beer produced and consumed. In the next post we will look into this a little bit and try to gauge whether we really are at Peak Beer, at least relative to local demand. In a later post, I hope to dive into industry clusters and tourism.
* Note that these counts are based on the actual number of breweries submitting tax returns to OLCC and not based on something like the number of permitted breweries or trade group figures. These counts also involve judgement calls. Some breweries with multiple locations report production separately, while others do not. I do my best to combine figures for each company and do not look at each establishment alone. The one exception being McMenamins which really operate more as a chain of brewpubs. I count each McMenamins that brews beer separately, but do not count the non-brewing locations.

Disclaimer: Articles featured on Oregon Report are the creation, responsibility and opinion of the authoring individual or organization which is featured at the top of every article.