By Josh Lehner
Oregon Office of Economics
Notes on three new marijuana research pieces that has come out recently.
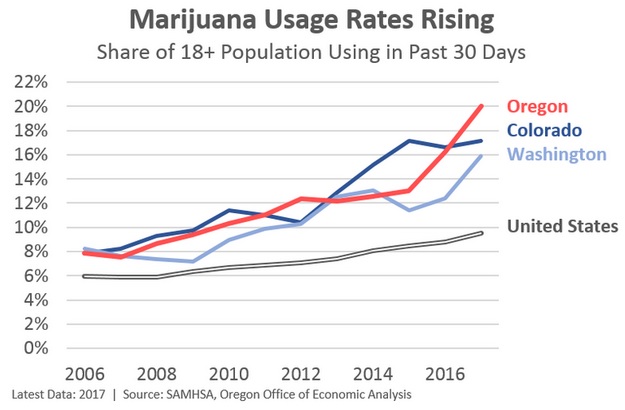
First, 2017 state level estimates of drug and alcohol use were released recently. What it shows is a continuation of trends related to marijuana use in the past decade. States with legal recreational and medical marijuana generally see the highest usage rates and have also seen the biggest increases.
Reported usage rates in Oregon have increased substantially over the past couple of years. Oregon is now #1 among all states with 20% of the adult population admitting they have used marijuana within the past month. Vermont (19%), District of Columbia (18%), Colorado (17%) and Alaska (17%) round out the Top 5. Now, it is somewhat of an open question just how much actual usage has increased versus residents becoming more willing to admit usage to federal survey takers. That said, these usage rates are up across the nation. Since 2009, only three states (GA, HI, SC) have not seen a statistically significant increase. National usage rates are up 3.2 percentage points (a 50% increase), with the median state seeing a 2.8 percentage point increase. Oregon’s increase is nearly 11 percentage points.
Second, OLCC released a new report to the Legislature on recreational marijuana supply and demand. Full disclosure, I was on the report’s review committee and think OLCC — Amanda Borup, Peter Noordijk, TJ Sheehy– did some really good work here and want to highlight the findings.
Probably the biggest take away from the report is that over the course of a year, Oregon’s recreational marijuana program produced about twice as much marijuana as was purchased by consumers. There are years of inventory currently sitting on the shelves at retailers, and being stored by producers and wholesalers. This is the supply-demand imbalance that is most measurable because it is in the legal system and tracked (for the most part). We know there is even more supply coming from the black and medical markets, which are not tracked. None of this is a huge surprise given everything we’ve seen and heard in recent years. What is new is that OLCC was able to quantify the imbalance and not just add anecdotal evidence. That’s the part I want to focus on.
Our friends at OLCC tackled at least two big technical challenges. First, they were able to wrangle the available data and create a methodology to reasonably compare supply (harvest, inventory, etc) with demand (sales across product types) on as close to an apples to apples basis as you can. Marijuana is wet and heavy at harvest time, but is sold dried or in the form of concentrates, edibles, and the like. You cannot just compare these final product types to harvest data. This was a big challenge to be able to properly compare these.
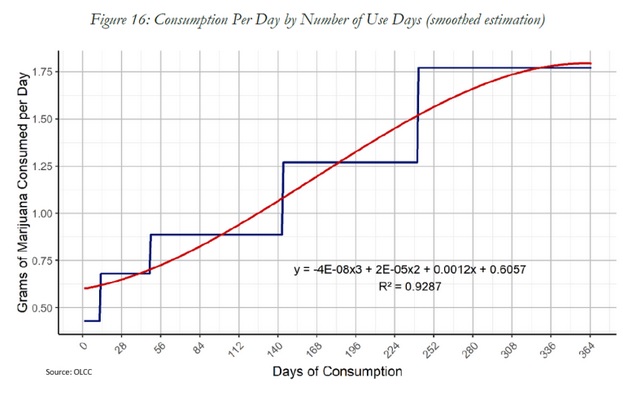
The other big technical challenge centered around estimating how much total marijuana is consumed in Oregon and running some scenarios (Monte Carlo simulations) to model the probability that demand is meeting supply. To get at statewide demand, across all markets, OLCC used survey data and some academic studies. You can see part of this work in Figure 16 below from the technical appendix to the report. What it shows is how much marijuana is consumed per day by frequency of use. As with most products, heavy users account for the vast majority of consumption.
From there they could compare actual sales to this estimate of statewide demand. They found that 55% of total statewide marijuana consumption was purchased at recreational retailers. That means 45% of consumer demand is being met by the black market, medical market, and/or home grows.
From a big picture perspective, there are some clear successes here. Recreational sales used to be 0% of the market and are now 55%. Additionally, while there is an oversupply even within the recreational system, the vast majority of this product is remaining in the legal system. Currently inventory stands at around 6.5 years of sales (based on amount of THC). This is a huge number, full stop. But it also means most of the oversupply is being accounted for. All of that said, there is a concern that more may be diverted to the black market and/or out of state given current market conditions (high supply, falling prices, and a huge pipeline of applications for new entrants into the market).
The report also notes the different channels in which demand can increase to meet current production levels. This includes an increase in the number of consumers (like the first chart above), more consumption by current users (increases in the second chart above), and/or increased market share for recreational marijuana. I believe we will see improvements in all three areas. In fact the usage numbers reported above are already above the Monte Carlo upper bound from the OLCC report — note that this is just one component of the work and by itself is not enough to overturn the findings. However, given that big pipeline of applications for new producers, processors and retailers, the supply side doesn’t look like it’s slowing down any time soon either. The market continues to search for an equilibrium.
Third, the Brewers Association’s Chief Economist, Bart Watson, recently wrote up his thoughts and findings on the impact of cannabis on beer. He also provides a link to a distilled spirits report looking at cannabis and spirits, but I haven’t read that yet. In sum, Bart finds no evidence of cannabis impacting beer sales. Yes, per capita beer sales are falling but they were falling before much of the marijuana legalization in recent years. And recreational or medical state trends for beer are not different. Bart explains “most of beer’s decline [is] due to competition with wine/spirits [due to] things like demographics and prices.” There’s a lot more in his article, including thoughts on how to interpret survey results, how all of this may shift moving forward and how cannabis is impacting business operations, even if not sales (yet).
Disclaimer: Articles featured on Oregon Report are the creation, responsibility and opinion of the authoring individual or organization which is featured at the top of every article.


