Per Capita Personal Income in Oregon
Oregon Workforce and Economic Information
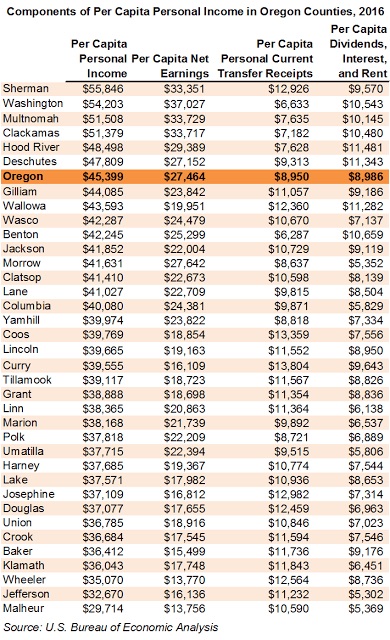
In 2016, Oregon had a per capita personal income (PCPI) of $45,399. Oregon’s PCPI ranked 29th in the United States and was 92 percent of the national average, $49,246, according to the U.S. Bureau of Economic Analysis. In Oregon, the 2016 PCPI increased by 2.4 percent from 2015, faster than the nationwide PCPI growth rate of 1.6 percent.
Per capita personal income also varies between states and counties, and by metro and nonmetro areas. A look at county numbers shows high variability in PCPI. In general, PCPI is higher in the Portland and Bend area and along the Columbia Gorge. Sherman County, a nonmetro area, actually had the highest PCPI in 2016 at $55,846.
The three major components of per capita personal income – net earnings; transfer receipts; and dividends, interest, and rent – make up different portions of counties’ PCPI. In general, counties with higher PCPI have a higher percentage of PCPI attributable to net earnings. Per capita net earnings made up 66.3 percent of PCPI in Washington County and 60.4 percent in Multnomah and Clackamas counties. In Malheur County, per capita net earnings made up just 24.6 percent of PCPI.
Areas with a higher concentration of older residents can show lower PCPI. In Oregon, Malheur County ($29,714) and Jefferson County ($32,670) had the lowest PCPI. The reason is that as people leave the labor force, they have likely passed their peak earning years, and therefore have less contribution to the net earnings component of personal income. Remember PCPI represents income, rather than wealth. Older residents may have substantial wealth, but not have as much relative income, unless it was income-generating investments that would show up in the “dividends, interest, and rent” portion of PCPI.
Disclaimer: Articles featured on Oregon Report are the creation, responsibility and opinion of the authoring individual or organization which is featured at the top of every article.


