About That #1 Revenue Growth
By Josh Lehner
Oregon Office of Economic Analysis
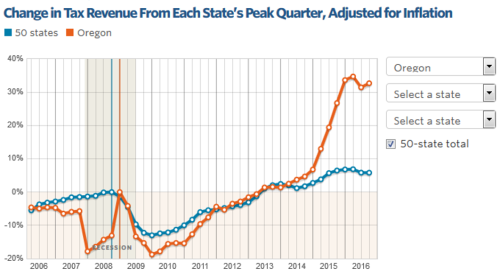
You’ve seen it, I’ve seen it, we’ve all seen it. Oregon leads the nation in revenue growth. It sounds reasonable doesn’t it? Oregon’s economy is more volatile overall and generally outperforms the typical state. In recent years we’ve been Top 10 for employment, personal income, and state GDP growth, so naturally revenues would follow suit. Well, not so fast. The broad point that Oregon revenues are doing better than most states is true, but the magnitude of the changes and the exact state ranking is incorrect.
Let’s start with the Pew “analysis” that is the source of the maps and charts comparing state revenue growth. Hmm. The Oregon data just looks … off. The type of jump seen in 2015 — nearly 30% overnight — just doesn’t happen. Possibly something like oil-related revenues in Alaska or Texas may, but we know Oregon’s General and Lottery Funds didn’t increase that much. So what happened?
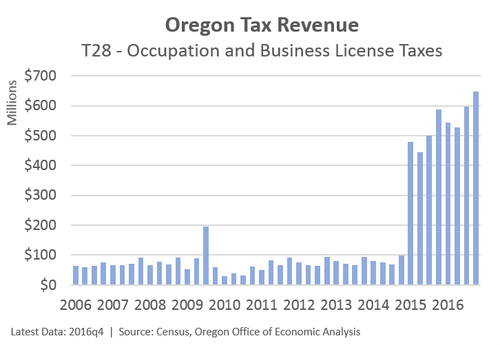
Well, if you look at the underlying data published by Census you see the same thing. Pew just copies and pastes the data from Census and does an inflation adjustment. It turns out the jump is caused by a massive increase in Occupation and Businesses License Taxes, or code T28. In speaking with the folks at the Census Bureau this includes: tire disposal, hazardous waste, petroleum load, and dry cleaners fees. How on earth could those increase overnight to become Oregon’s second largest revenue source, trailing only personal income taxes? Well, they can’t. And they didn’t. Turns out there is a coding error and the data is incorrect.
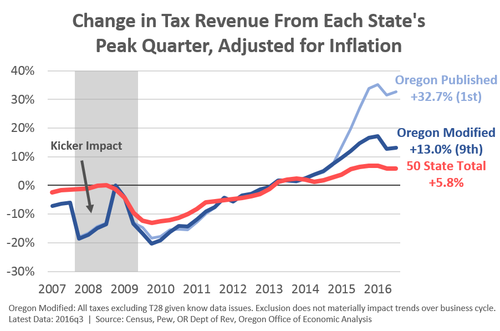
I know it’s not as sexy as being number one, but it looks like Oregon should probably be number nine. If you strip out the T28 revenues — Census is working on revising the data and will do so in the relatively near future — and compare Oregon’s trends you get the adjusted graph below. There is no question that Oregon’s revenues have seen better growth overall than the typical state because our underlying economic growth has been better. We just haven’t done an order of magnitude better than the typical state. This modified ranking places us a little behind California and a little ahead of Washington, which sounds just about right.
Additional Notes:
– The Census Bureau tries their best to pull all this information together. It is a very hard task to do and issues arise. Our office knows because we act as at least part of the clearing house for the Oregon data. It comes from many different places and sources. Our office has had issues trying to get this together and out the door. We have made mistakes and also not been able to complete all the line items in a timely manner in the past. We are trying to figure out a better process to ensure more complete and more timely reporting to Census. So our hands here aren’t entirely clean either.
– In talking with Census and our counterparts in other states, it is clear that every state has some idiosyncratic events that impact their revenue flows. It makes it hard to do some of the work that folks like Pew are trying to do for this reason. You really need to try and understand local issues (tax structures, base calculations, exemptions, etc) to understand these bigger trends. Employment and income comparisons are easy. State and local taxes are not. For example, as I noted in the last chart above, Oregon’s kicker payouts cause large year-to-year changes that aren’t indicative of the underlying economy or broader revenue trends.
– All of this said, the jump in the 2015 Oregon data should have set off some data analyst’s Spidey sense. For folks like Pew, trying to upgrade their state comparison work, something like that would be a natural place to dig into the data to understand what is happening. Figuring out why different states are seeing better or worse growth would add tremendous value. They’re just not doing it now, nor did they previously when looking at state revenue forecasting.
– Lastly, there are two general statements about state revenues making the rounds. The first talks about changes from before the Great Recession through today. This is the correct way to look at the situation. The second one compares revenue growth from the depths of the crisis through today, measuring growth just in the expansion to date. This is neither a good nor useful way to measure revenue growth. Some states and some revenue streams are more volatile. Only measuring changes over part of the cycle simply muddies the water and does not lend itself to being helpful.
Disclaimer: Articles featured on Oregon Report are the creation, responsibility and opinion of the authoring individual or organization which is featured at the top of every article.


