![]()
By Josh Lehner
Oregon Office of Economic Analysis Blog
This is part 2 of 2 this week on housing, see here for part 1. Given that housing and affordability are at the forefront of many people’s minds these days, I have been doing quite a bit of data work to help myself understand what exactly is going on. While the data and focus here is on Portland, the results are generally transferable to other parts of the state, particularly other metropolitan areas.
As you may have expected, the housing bubble and its aftermath is still having big ramifications in the housing market today. First the bubble increased the number of sales during the mid-2000s given the lower underwriting standards but also the psychology of the market during the bubble era. Second, for the majority of households that did not get foreclosed on, they were effectively trapped in their homes due to the significant loss of value. Only now are we starting to see nearly all homes above water.
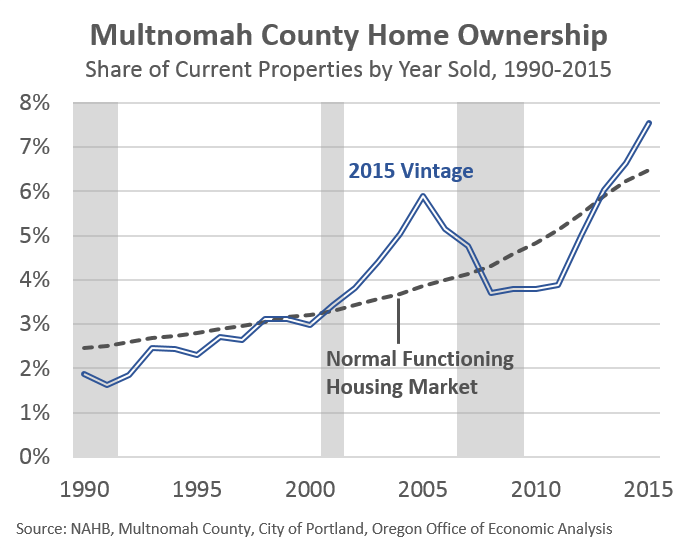
This is readily evident in the graph below showing how the current ownership pattern in Multnomah County compares to some work from the National Association of Home Builders from prior to the bubble. Their work was based on national data, but acts as a reasonable benchmark of how different today’s pattern actually is. Essentially, there are a whole lot more people still living in the same home for about 10 years then you would expect in a normally functioning market. Historically these likely would be part of the move-up buyer population which is missing today.
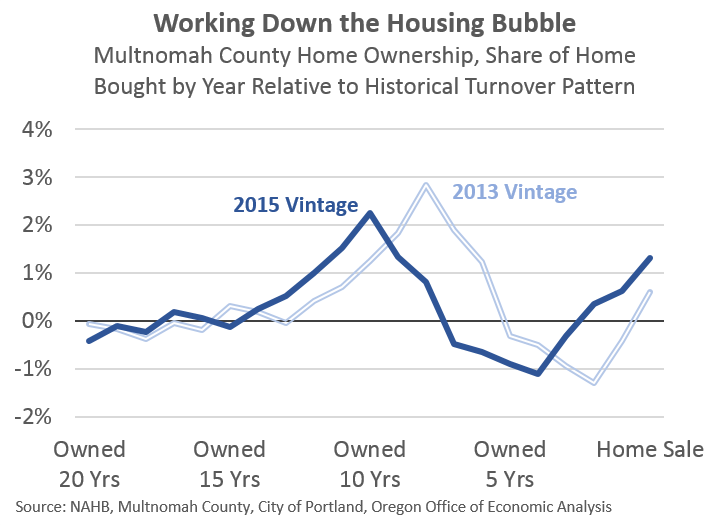
While this second graph is a bit confusing — going from right to left to match the first graph — it compares current ownership to a couple years ago. Overall the pattern is very similar, just lagged 2 years, but the good news is the peaks and valleys are better today. As the market continues to return to normal, expectations are for this overall pattern of ownership to smooth out.
One final thought. I find it hard to imagine that these patterns are not impacting the ongoing Portland Public School boundary review and potential realignment. While it is natural for population patterns to shift over time, the housing bubble has resulted in a broken market, making it harder for families to move or relocate in the past decade. So we have more young families than expected in some neighborhoods and less in others (more empty nest households looking for those move-up buyers?). Expectations are for these issues to correct as the economy continues to improve and the housing market makes progress toward normal. Another possibility, as we are seeing it happen too, is the increase in remodeling. As some households were unable to move, they made due with what they had and improved it to meet their needs. To the extent that remodeling solves their housing needs, expectations are more there to be less moving.
Disclaimer: Articles featured on Oregon Report are the creation, responsibility and opinion of the authoring individual or organization which is featured at the top of every article.


