![]()
By Josh Lehner
Oregon Office of Economic Analysis Blog
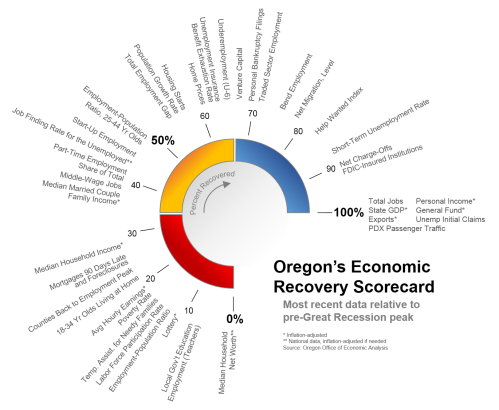
Many headline economic numbers have reached pre-Great Recession peak levels, including jobs, income, state GDP, exports and the General Fund. However you can’t eat GDP and we know all is not well with the economy, even if it truly is getting better. Our office has highlighted some of the bigger picture issues with the economy in recent years, including the long-term unemployed, the urban-rural divide and middle-wage jobs. To take the analysis a step further, our office is introducing the Economic Recovery Scorecard which examines the recovery across 39 individual economic measures. While the top line data are back to peak, or at historic highs, how do each of these other measures compare? The chart shows how far each of these measures has recovered from the depths of the recession through the most recently available numbers. Click on the graphic for a larger, easier to read version.
What Oregon and the nation have regained in recovery is not exactly the same as what we lost. Differences abound across nearly all measures. One example is the number of jobs. Overall the economy has fully regained the number of lost jobs due to the Great Recession. However we have not regained the same jobs that we lost. Traded sector employment is about 70 percent regained in Oregon, while the broader middle-wage jobs are about 40 percent regained. Continuing further, public sector budgets are back but local government education employment (largely teachers) is just 10 percent recovered. So even as the total number of jobs is currently at an all-time high, the specific nature and types of employment clearly is not. Similar stories across metrics can be told if one focuses on the housing market, or demographics, or any other swath of the economy. The headline numbers are largely back, but the specific underlying components are still at various stages of recovery.
Additionally, our office is not expecting all of these measures to get back to peak levels, regardless of the strength in the economy. Some, such as the overall labor force participation rate, are down in large part due to demographics. (Plus some due to a weak economy, more on that next week) Given the way LFPR is measured (share of total population 16+), there is a high probability it will not regain its peak rate circa 2000 until the Baby Boomers are not longer with us. That’s due to the definition of the measure and demography, not about this particular economic expansion. Other measures, like the share of young adults living at home, the number of counties or states back to their employment peak, or even middle-wage jobs (a lot of construction workers and teachers) will take time to recover, even with a relatively stronger economy. Provided a sufficiently strong recovery that lasts, which so far we are getting for the most part, our office’s expectation is that these measures will recover. Not overnight, but in time they should/will get back.
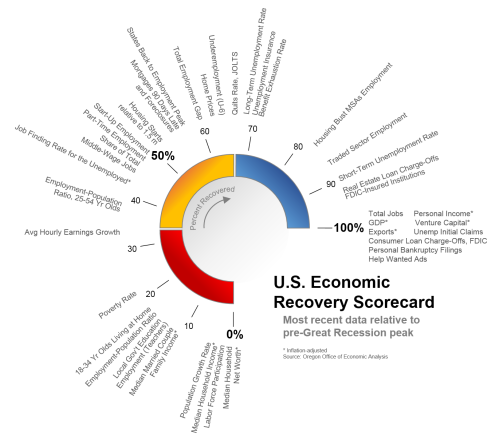
Below is an analog U.S. version of the Economic Recovery Scorecard. Nearly all measures are the same, however there are a few differences due to data limitations and the like. This concept could also be used for other states, to look at employment across industries, or across states, or counties within states and the like.
Stay tuned next week as we’ll talk about the outlook for middle-wage jobs in Oregon and also when the state can reasonably expect to get back to something along the lines of full employment.
Disclaimer: Articles featured on Oregon Report are the creation, responsibility and opinion of the authoring individual or organization which is featured at the top of every article.


