![]()
By Josh Lehner
Oregon Office of Economic Analysis Blog
Oregon is an in-migration state. For many years, more people have moved into Oregon each year than have moved out of the state. This population growth fuels the expansion of our cities and brings new brain power to foster the economic engine of Oregon’s future. Workers in some occupational groups are more likely to move than others. Where do these in-migrants come from? And when Oregonians leave, where do they go?
New data from the American Community Survey (ACS) five-year panel (2007-2011) can provide some information about migration characteristics that hasn’t been available before. Specifically, we can now look at migration into and out of Oregon by major occupational group.
The largest occupational groups also had the largest net in-migration numbers. The top five occupational groups by net in-migration are in a similar situation – they employ a lot of workers, so their average in-migration during the period accounted for about 2 percent of their 2012 employment. That share is pretty typical; most groups had in-migration numbers ranging from 1 to 3 percent of their estimated 2012 employment. (This is not a scientific calculation: the 2012 employment numbers by occupation have no bearing on migration patterns, but they do provide a context for migration trends in different occupational groups.)
The first surprise is in arts, design, entertainment, sports and media, where net in-migration is estimated above 1,100 per year. This is a small group of occupations in Oregon, with 2012 employment estimated at almost 24,000, so the net in-migration in Table 1 accounted for about 5 percent of 2012 employment. The next occupational group with an above-average magnitude of net in-migration when compared with employment levels was community and social services workers.
Military occupations are the only group where net in-migration is negative: the number of people in military occupations that move out of Oregon exceeds the number moving into Oregon by close to 350 each year. That makes sense; since the state has no major military bases, service members would tend to move out.
Another way to look at this data is to think about the flow of people in and out of the state. If you sum up Oregon’s in-migrants and out-migrants by occupation, it’s possible to see where there’s a lot of flow, but since it is in both directions it isn’t captured by the net in-migration numbers. For instance, the 1,228 net in-migration for managers masks the true level of flow in that area – an average of nearly 13,000 management workers move in a given year, but we’re gaining only 1,228 more managers than we’re losing. Another field with high levels of migration flow is the transportation and material moving occupations, where nearly 9,500 workers move, but those moving in only outnumber those moving out by about 1,500. Construction trades have just about 8,400 workers moving either in or out of Oregon each year, but there the in- and out-flow are fairly close, leaving a net in-migration of just 400 workers each year.
| Average Annual Migration by Occupation Group (2007-2011) | |||
| Oregon In-Migrants |
Oregon Out-Migrants |
Net In-Migration Estimate |
|
| Sales | 12,687 | 8,816 | 3,871 |
| Office and Administrative Support | 12,826 | 8,988 | 3,838 |
| Food Preparation and Serving | 9,515 | 6,113 | 3,402 |
| Education, Training, and Library | 6,170 | 3,540 | 2,630 |
| Healthcare Practitioners and Technical | 5,272 | 3,140 | 2,132 |
| Personal Care and Service | 4,432 | 2,856 | 1,576 |
| Transportation and Material Moving | 5,504 | 3,987 | 1,517 |
| Farming, Fishing, and Forestry | 2,016 | 588 | 1,428 |
| Production | 4,577 | 3,282 | 1,295 |
| Management | 7,060 | 5,832 | 1,228 |
| Community and Social Services | 2,284 | 1,065 | 1,219 |
| Building and Grounds Cleaning and Maintenance | 3,663 | 2,456 | 1,207 |
| Arts, Design, Entertainment, Sports, and Media | 3,419 | 2,272 | 1,147 |
| Computer and Mathematical | 3,198 | 2,110 | 1,088 |
| Business and Financial Operations | 3,302 | 2,222 | 1,080 |
| Architecture and Engineering | 2,149 | 1,354 | 795 |
| Protective Service | 2,020 | 1,248 | 772 |
| Life, Physical, and Social Science | 1,556 | 1,120 | 436 |
| Construction and Extraction Workers | 4,401 | 3,966 | 435 |
| Installation, Maintenance, and Repair | 2,368 | 1,993 | 375 |
| Healthcare Support | 1,760 | 1,569 | 191 |
| Military | 1,788 | 2,138 | -350 |
| Source: U.S. Census Bureau, American Community Survey, 2007-2011 five-year estimates. | |||
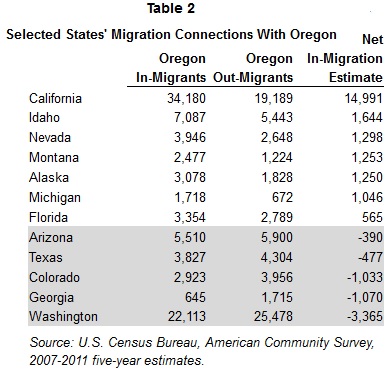
Many of the states in Table 2 won’t come as a surprise. Oregon shares migration flow with all of its neighbors and several other western states. This table doesn’t tell the full story – there was migration flow between Oregon and every other state in the nation between 2007 and 2011. States are included in the table when in-migrants or out-migrants numbered more than 3,000, or when net in-migration exceeded 1,000.
California was by far the greatest source of net in-migrants to Oregon. An estimated average of 34,180 people moved from California to Oregon each year during the period, while 19,189 moved from Oregon to California – leaving an estimated net in-migration of roughly 15,000 each year. On the other end of the scale, the largest out-migration was to Washington. Oregon loses about 3,400 more residents to the Evergreen State each year than it gains from that source.
| Selected States’ Migration Connections With Oregon | |||
| Oregon In-Migrants |
Oregon Out-Migrants |
Net In-Migration Estimate |
|
| California | 34,180 | 19,189 | 14,991 |
| Idaho | 7,087 | 5,443 | 1,644 |
| Nevada | 3,946 | 2,648 | 1,298 |
| Montana | 2,477 | 1,224 | 1,253 |
| Alaska | 3,078 | 1,828 | 1,250 |
| Michigan | 1,718 | 672 | 1,046 |
| Florida | 3,354 | 2,789 | 565 |
| Arizona | 5,510 | 5,900 | -390 |
| Texas | 3,827 | 4,304 | -477 |
| Colorado | 2,923 | 3,956 | -1,033 |
| Georgia | 645 | 1,715 | -1,070 |
| Washington | 22,113 | 25,478 | -3,365 |
| Source: U.S. Census Bureau, American Community Survey, 2007-2011 five-year estimates. | |||
One caveat to using this data series is that out-migration is not captured for international destinations. That means that net in-migration is overstated for an occupational group or geographic area when there has been some migration to other countries, and we have no way to tease that out using these estimates. It is possible that movers to international destinations are concentrated in particular occupations, and if that is the case then these estimates miss the boat to some extent. Let’s put some numbers with this generality: based on ACS data, Oregon’s average net in-migration during the 2007 to 2011 period was 43,918. In comparison, more robust estimates from the Population Research Center at Portland State University show average net in-migration of about 17,500 per year. The discrepancy is attributed to the lack of destination data for international out-migrants.

Disclaimer: Articles featured on Oregon Report are the creation, responsibility and opinion of the authoring individual or organization which is featured at the top of every article.