![]()
By Josh Lehner
Oregon Office of Economic Analysis Blog.
Two important events occurred in recent weeks. There was the great new research on economic mobility that examined different cities and regions across the country (official website here, good NYT summary here) and there was also the Detroit bankruptcy. Given the close proximity in timing of these, a lot of the econ blogosphere discussions tied the two together, at least roughly. See Krugman on Detroit and on economic mobility. See Wonkblog on Detroit here and here. See Yglesias on mobility. To list but a few.
Part of the national narrative that everybody knows is that Detroit has been in decline for quite some time. Lost jobs, lost population, automakers struggling in recent decades, etc. What wasn’t as well known was that Detroit proper was in much worse shape than the suburbs (see the Wonkblog links in particular). Even as the auto industry stabilized and rebounded some, these jobs were nearly all in the suburbs and not Detroit itself. So, combining this with the economic mobility and sprawl research, why do we care?
A couple of different reasons. First, we know that strong urban cores and the agglomeration effects are great for economic growth (knowledge spillovers, cluster development, etc). However along with the urban benefits come urban problems. You have more density, more congestion, more crime, higher housing costs and the like. Not to mention you also have more usage and stress on the infrastructure, which requires money to maintain and hopefully upgrade. If you have all these things but no tax base, it becomes very difficult to successfully run and fund a city. Or if the demographic and economic trends turn against you, like in Detroit, it creates solvency issues given that today’s population and tax base is smaller than both the built environment was designed for and paying for retirees.
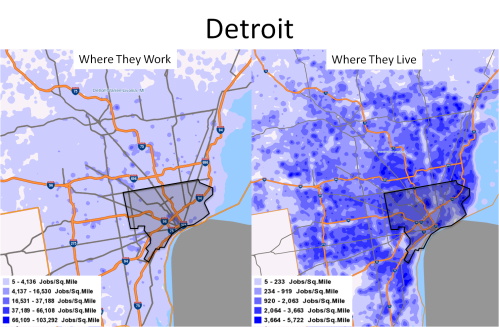
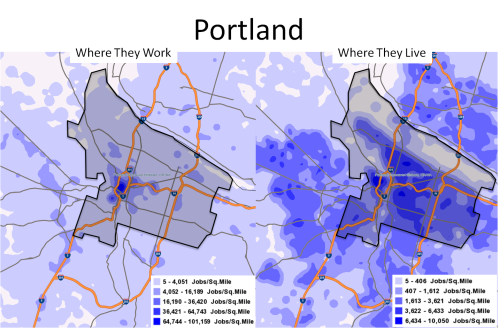
Given all of this, I wanted to take look at how urban cores compare with overall MSAs or the suburbs. There are a number of different ways to go about this. For example one can use the Census’ County Business Patterns data to look at job disbursement by zip code, for instance. Or use Brookings job sprawl data that looks at the share of jobs within certain radii from the central business district. Both of those are great. However I was trying to get a visualization of jobs across MSAs both based on where people actually work and where they live. I turned to the Census’ On The Map site for just this purpose and have copied some of their maps below. The black outline is my rudimentary estimate of city boundaries. The maps on the left are where people with jobs actually work and the maps on the right are where these same employed persons live (all 2011 data). I chose these MSAs to look at either because these cities are famous for sprawl, were heavily discussed in the economic mobility articles and/or are usually used as peer cities for Portland comparisons.
Detroit: clearly there are pockets of strong employment in the suburbs without a strong central core, and employed people generally also live in the suburbs, combine this with the most pronounced population declines being in Detroit proper, and you get an extreme case of central city abandonment
Portland: has a strong concentration of jobs in both its urban core plus the string of westside suburbs (the Tigard – Beaverton – Hillsboro corridor along Highways 217 and 26). The location of area jobs closely matches the pattern of where its workers live. This is consistent with the notion that the state and region’s (pick your adjective: good, strong, strict, tight, $*&*#) land use laws have resulted in higher density and a stronger concentration of jobs close to downtown and Washington County.
Atlanta: a lot of sprawl and suburban jobs, even as downtown core has a strong concentration of employment
Denver: sprawl but with a strong core and then strong pocket of jobs down in the Cherry Creek/Tech Center region which is right along city boundaries
Houston: notorious for sprawl yet the employment concentrations remain within the city limits
Seattle: employment is more spread out with Bellevue and Redmond areas also having concentrations however on a residency basis, Seattle proper has a strong core
Finally, here is a quick summary table of the Brookings job sprawl data for 2010. The numbers show how close jobs are to the central business district.
Based on all of this, Detroit and Portland really are on opposite ends of the spectrum when it comes to economic growth, development and planning. Detroit has a substantially smaller share of jobs in the urban core than even the sprawling cities of Atlanta and Houston (two of the poster children). Portland has an average level of employment within 3 miles of downtown, however the job strength in the westside suburbs isn’t that far away geographically and therefore the MSA ranks the highest among this small sample of MSAs (admittedly not a random sample). That’s not to say everything is perfect in Portland, far from it, Portland and Oregon has its own challenges with job and income growth. However, theoretically, growth and development in this general pattern should result in both the urban benefits and the urban problems. Furthermore, by maintaining a strong population base in the city, funding these “problems” and services should also be easier, again theoretically.
Posted in Demographics, Employment, State Comparisons | Tags: atlanta, comparing cities, comparing MSAs, denver, detroit, development, economic mobility, economic opportunity, Growth, houston, job sprawl, Metro, metropolitan statistical area, MSA, portland, seattle, sprawl, urban, urbanization
Posted by: Josh Lehner | July 25, 2013
Professional Jobs
Now that we’ve been in technical expansion for 4 years and adding jobs for more like 3 years on a sustained basis, more and more discussions are turning from the durability or sustainability of the recovery to the quality of the recovery. That’s not to say the pace of expansion is acceptable or even modest by historical standards, and, yes, many dark scenarios remain (China, Europe, austerity, etc), however the risk of recession has certainly fallen in the past couple of years. Given that Oregon has now regained about 56% of the private sector jobs lost in the Great Recession, questions are being asked about which industries these jobs are in and whether they are “good” jobs or not.
This post takes a quick look at one of the leading sectors in the economy, at least in terms of employment: Professional and Business Services. Overall, jobs in the industry fell 11% but have rebounded at an annualized 3.3% rate since late 2009. Today these jobs are at an all-time high and a few thousand above pre-recession levels. This stronger growth and being a leader in expansion was not unexpected. As the economy continues to evolve and transform from the more traditional manufacturing-based economy into a more service-based one, better job growth in professional and business services is and was expected.
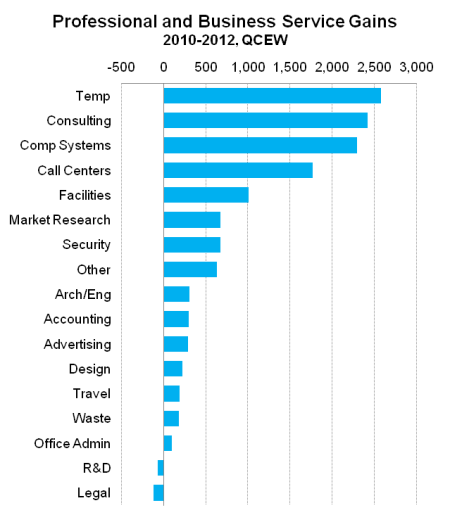
Now, a lot of times when discussing employment trends we only focus on these bigger industries and don’t dive down into more granular details. However with that sharper focus on the quality of the jobs being created, it is important to try and understand just what type of jobs are being created. The graph below breaks out these professional and business service jobs into smaller industries or groups of industries. One can even go further and look at more details, however I believe these categorizations provide a good overview and understanding of the dynamics within the larger industry.
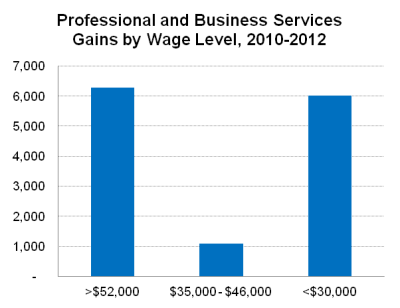
The actual number of job gains do seem to be a bit concentrated in those top 4 or 5 listed groups, however it is important to note that nearly all sub-industry groups have seen gains in the past couple of years. As you read down the list and see the size of employment gains, your mind may turn to the wages and quality of jobs within these groups. The statewide average wage in 2012 according to the QCEW was about $44,300, so I have grouped the job gains shown above into three buckets based on industry wages. The results indicate that job gains in high-wage industries actually outstrip low-wage industries, albeit barely. Overall we see similar levels of gains in both the high-wage and low-wage industries with none in the middle-wage industries. The fact that there have been high-wage gains at least on par with low-wage gains may come as a surprise to some as it is not generally part of the standard narrative.
Note that this is the same general pattern seen in job polarization throughout the economy and we finally have light at the end of the tunnel for the polarization report I have been mentioning for over a year now. It will be released later this summer or early fall.
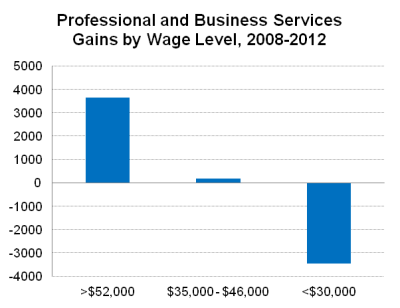
The graph above shows where the job gains have been in recovery, however what does the picture look like when trying to gauge trends since peak? Again, using annual data, the graph below shows job gains by industry wages from 2008 to 2012. Over the four year period Oregon has actually seen a net gain among the high-wage industries, essentially no change in the average-wage industries and have still lost jobs on net among these low-wage professional and business service jobs. One reason for this is the cylicality of something like temp workers (or employment services, more accurately). While these jobs have rebounded in recent years (and some think they are also a leading indicator) they remain below pre-recession levels as they declined substantially (-15%) from 2008 to 2010.
Finally, I will also point out that while professional and business services have been a leader so far in expansion and our office looks for this broad industry to continue to outpace job growth overall, these jobs are not evenly spread throughout the state. Nearly 84% of the gains from 2010 to 2012 in the industry have occurred in the Portland MSA. We know that large cities both turned around first in expansion and have been the major driver of growth so far in recovery, however now that recovery is spreading to more or more regions of the state and country, job growth is beginning to pick up.
Posted in Employment, News | Tags: Employment, Oregon, Jobs, Recovery, 2010, Improvement, 2012, job, gains, workers, research, business, high wage, low wage, advertising, services, average wage, architectural, profession, temp, temporary, temp worker, consulting, computer systems, call centers, facilities, market research, security, architecture, engineer, engineering, accounting, design, travel, waste, office, admin, adminstrative, r&d, development, legal
Disclaimer: Articles featured on Oregon Report are the creation, responsibility and opinion of the authoring individual or organization which is featured at the top of every article.

