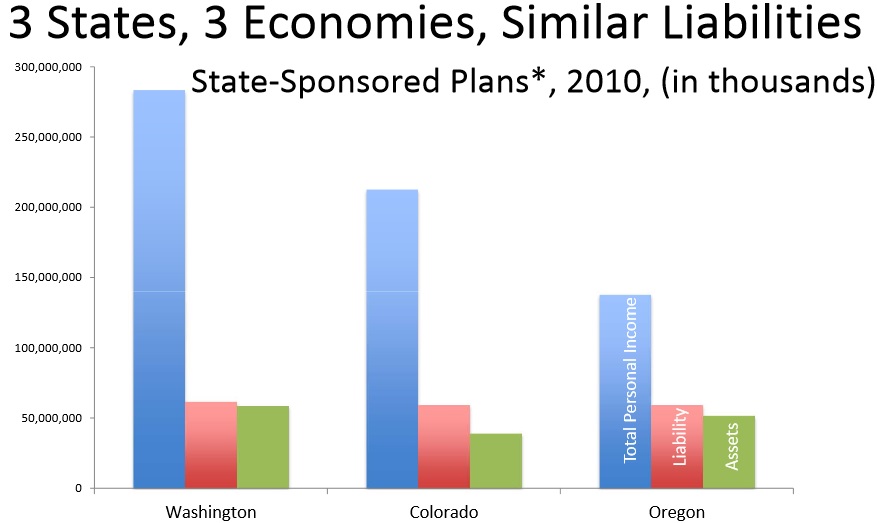
Source:Pew 2012and BEA;*All three states deliver pensions to state and local public employees primarily through state ‐ sponsored plans (that is,98% of membership in OR and 95% in WA and CO).In each state, a number of separate,local government plans exist and are not reported here.
Oregon’s public employee retirement system is exacting a heavy toll on our education system, our public safety, and our public services. In fact, the Oregon PERS Board recently determined that Oregon’s state agencies must pay a 45% rate increase – totaling $2 billion over the next two years – to address PERS’ $16 billion unfunded liability. This is $2 billion that will not go to hire any new teachers, increase our number of school days, or reduce class sizes. The added PERS burden may even spur talk of tax increases to cover the skyrocketing costs.
Oregon’s ongoing problems with its pension system are rooted in complex, poorly understood plan designs, successive increases in benefits beyond what was originally intended or needed for adequate retirement, and inherently volatile capital markets.
The Oregon Prosperity Project will be discussing and promoting several options to reduce the cost of PERS while promoting a sustainable government employee retirement system that is fair to both retirees and taxpayers
Disclaimer: Articles featured on Oregon Report are the creation, responsibility and opinion of the authoring individual or organization which is featured at the top of every article.


