![]()
County Population Forecast
By Josh Lehner
Oregon Office of Economic Analysis Blog.
One important item our office produces that flies somewhat under the radar unless you are in local government or land use issues on a regular basis is the county level population forecast. Kanhaiya, the state demographer, recently finalized the long-term county outlooks, anchored to the new 2010 Census figures and using the PSU Population Research Center estimates for 2011 and 2012. What follows is a quick overview of the population growth through 2025, however the Excel file over on our main website, has population by age, sex, births, deaths and net migration for each county through 2050.
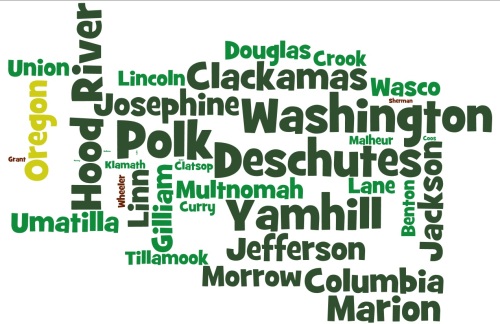
In terms of population growth rates by county, Andre put together another great word cloud to show where the growth is expected to occur. This data is for 2012 to 2025 growth when the state total is expected to grow 16.3%. Out of Oregon’s 36 counties, 3 are expected to lose population (Grant, Sherman, Wheeler) and are colored red, while 20 are projected to grow between 0-15% and colored light green, while the remaining 13 counties are expected to grow more than 15% and colored dark green.
The fastest growing counties in the coming decade are largely expected to be the fastest growing counties in recent decades, namely the ones that are part of the state’s MSAs: Portland, Salem, Bend and Medford. In fact, the 5 Oregon counties in the Portland MSA (Clackamas, Columbia, Multnomah, Washington, Yamhill) account for nearly 47% of the state’s population in 2012, however these counties will account for about 53% of the population growth between now and 2025. Lane (Eugene) and Benton (Corvallis) counties are expected to grow at rates slower than statewide population.
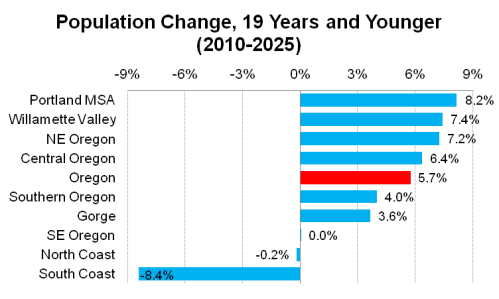
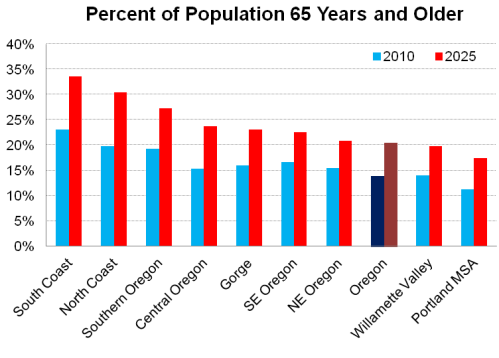
In terms of the composition of population growth and the changing demographics, the following three graphs look at the latest county forecast but aggregated by region of the state. These figures cover a slightly different time frame than the word cloud above and are from 2010 to 2025.
Net migration has been a large driver of population growth in Oregon for the past few decades. In the 1990s and mid-2000s, net migration accounted for nearly 3/4ths of total population growth (meaning the remaining 1/4 was due to natural increase, or births minus deaths.) Moving forward net migration will once again lead growth and account for 71% of overall population growth in the state. The graph below shows the share of each region’s projected population growth that is due to net migration. For the 3 regions that the share is above 100%, this means the regions are actually expected to have a declining rate of natural increase – deaths are forecasted to outnumber births in these regions.
As for the age composition of the population, except for the coastal counties, the actual number of children and teenagers is expected to increase across the state. These rates of growth are slower than total population, so as a share, youth are expected to decline relative to the statewide figures and in each region.
As you are aware, the population in Oregon and the nation is aging, due to the baby boomers as they begin to enter their retirement years. Each region of the state will see in increase in both the number of retirement aged individuals but also as a share of the local population. The graph below shows this increase and is sorted by the 65+ share in 2025, from highest to lowest.
If you are interested in learning more about the state’s demographics and forecasts, please visit our main site where you can find more information.
Disclaimer: Articles featured on Oregon Report are the creation, responsibility and opinion of the authoring individual or organization which is featured at the top of every article.


