![]()
By Josh Lehner
Oregon Office of Economic Analysis Blog.
The following post takes a look at Oregon Lottery sales from both a high level perspective in terms of consumer spending trends and from a somewhat longer perspective over the business cycle. What follows below is the baseline outlook our office has for both Lottery sales and available revenues to the state for budgeting purposes. This is the same outlook that was incorporated into our office’s latest quarterly economic and revenue forecast and also the same outlook I recently delivered to the rating agencies in explaining the forecast. To download the full report in PDF format, please click here: LotteryOutlook_0313
Introduction
There is no perfect comparison for Oregon’s unique video lottery system. As a result, our office looks at a number of different spending and gaming related benchmarks for comparative purposes. Useful indicators include: employment and earnings among Oregon’s hospitality firms, sales tax collections in neighboring Washington, gaming expenditures nationwide, and the performance of video machines at tribal casinos and in Nevada.
Comparisons with other gaming systems are not perfect. National data incorporates many types of gaming activities across regions. Las Vegas relies upon large casinos and out-of-state tourism. Oregon relies more upon locals and spending in the bars and restaurants across the state. However, even with these underlying differences, broader consumer spending trends have become clear in recent years.
In the aftermath of the Great Recession, there has been a resetting of consumer spending on gambling and gaming activities. This is true at the national level based on the Bureau of Labor Statistics’ consumer expenditure data. This is true in Nevada, based on slot machine revenues from Las Vegas and elsewhere in the state. And this is also true in Oregon, based on sales at the 12,000 video lottery terminals throughout the state.
Great Recession Losses
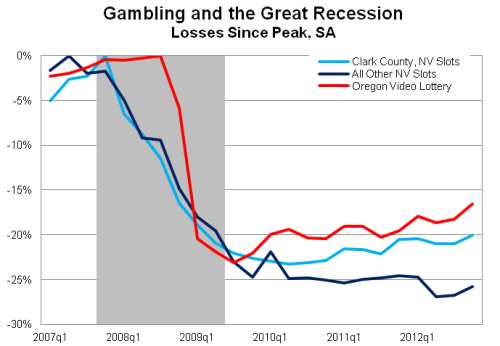
The first chart gives a high level look at the recession’s impact on gaming revenues in Nevada and Oregon. The chart shows the percentage change in spending from the pre-recession, or business cycle peak levels. Both Nevada slot machine revenues and Oregon video lottery revenue fell by 20-25% during the financial crisis. Since hitting bottom in late 2009, Oregon’s video lottery revenues have begun to slowly climb back, and are up 8.6% from the depths of the recession. Clark County, Nevada (Las Vegas) slot machine revenues bottomed in 2010 and likewise have begun to increase again, however are up just 4.2% through the end of 2012. Slot machine revenues elsewhere in Nevada have yet to fully turn the corner and remain about 25 percent below their 2007 highs.
This overall pattern of large recessionary losses and a slow climb out was not wholly unexpected, particularly given that a slow recovery has been built into most underlying economic outlooks for the past few years. What was somewhat unexpected was the overall severity of the gaming declines, and the even more protracted recovery in revenues relative to underlying economic variables, such as income growth and of the broader “entertainment dollar.”
The Entertainment Dollar
The following graph illustrates U.S. consumer spending on entertainment as a share of income, based on data from the Consumer Expenditure Survey. Spending on entertainment in recent years exhibits a pro-cyclical pattern with this discretionary spending increasing more than income during the good times of the housing bubble and falling further during the recession. In 2011, broader spending on entertainment stabilized across consumer units at the national level. This broader stabilization of the entertainment dollar can be seen in other items such as sporting event attendance, increased tourism and eating out. Within the Consumer Expenditure Survey data this stabilization across the nation is also seen in both Alcoholic Beverages and Food Away From Home. Even the number of visitors to Las Vegas has reached pre-recession levels (HT: Calculated Risk), although visitors are not spending as much as they used to. The number of tourists is back, even if gaming revenues are not.
Without a sales tax in Oregon, we cannot track spending patterns in real time as well as other states. However, employment at leisure and hospitality firms has regained over 70 percent of recessionary job losses, and employment in video lottery establishments is all the way back. For comparison purposes, according to sales tax data from our neighbors to the North (Washington), sales tax collections from leisure and hospitality firms are essentially back to pre-recession levels on an inflation adjusted basis, and certainly from a nominal basis.
These measures show that consumers are spending more money on broader entertainment items, both in total and also as a share of their overall consumption. Where we have yet to see stabilization is the share of consumer spending on gaming activities, relative to income or overall consumption. Spending on gaming itself has increased – see the first graph – however these gains are below the overall gains seen in income growth or consumption.
The Gaming Dollar
Oregon Video Lottery Outlook
At this point, our outlook is for sales to continue to improve as the overall economy continues to improve. Consumers will spend more money on both the broader entertainment category and on gaming activities as employment continues to increase and income growth follows. Also, as population growth continues (adding more individuals and more income to the state), our expectations for lottery sales improve. However, growth in gaming will not keep up with the rest of the economy. The gain in video lottery sales is expected to be just a bit under the total personal income growth rate in the state, and thus the share of income spent on video lottery will continue to erode somewhat.
So far in recovery the economy has been adding jobs back slowly and wage and salary gains have been weaker than previous expansions. Income gains, particularly in percentage change terms, have also been weighted toward investment and asset-based types of incomes due largely to the stock market rebound in recent years. Investment income has a smaller impact on lottery sales than does housing wealth or wages. Also, the Oregon Lottery is only one provider of games in an increasingly competitive marketplace.
However, given the strong sales seen during the housing boom, there is upside risk to the sales outlook. To the extent that employment and wages grow more quickly than the baseline economic forecast, a pickup in the share of income spent on video lottery is not out of the question. As seen in the graph above, during the height of the past expansion the share of income spent on video lottery was much higher. This illustrates that there is certainly capacity for video lottery sales to grow both in terms of the level of sales and in terms of the share of consumers’ budgets.
We were not and are not expecting this share to rebound strongly, however we are expecting it to stabilize as the economic expansion strengthens in the coming years.
Oregon Overall Lottery Outlook
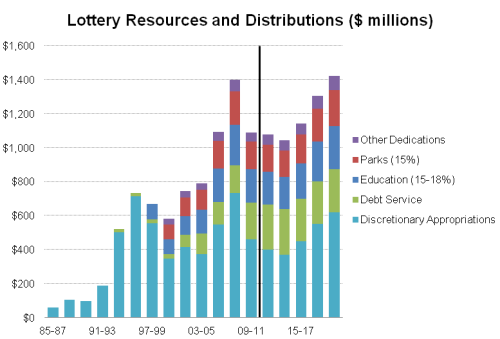
The overall lottery outlook for the state largely follows this same general pattern as transfers from video lottery account for about 85 percent of available resources. Two further important items to highlight are the impact of the federal payroll tax cut expiration and the video lottery terminal replacement program that Lottery is undertaking over FY2014-17. First, the payroll tax cut expiration is expected to shave just over 1% off of growth in 2013 which amounts to about $7.7 million in sales or $5.0 million transfers. (Although, as shown previously, recent sales have picked up in late February and early March) Second, over the next two biennia Lottery will be replacing the 12,000 existing terminals throughout the state, some of which will be nine years old when replaced. Due to advancements in technology, the current machines are becoming obsolete in the marketplace. This replacement plan is expected to cost approximately $215 million over four years, of which Lottery will self-fund $85 million. The remaining $130 million will be deducted from Lottery earnings prior to being transferred for general revenue purposes. The biennial impact of the replacement plan is $71.2 million in 2013-15, or approximately 7.2% of available revenue to be transferred, and $59.2 million in 2015-17, or 5.5%. The projected available resources, after accounting for the replacement plan, can be seen in the graph below.
Again, to download the full report in PDF click here: LotteryOutlook_0313
Disclaimer: Articles featured on Oregon Report are the creation, responsibility and opinion of the authoring individual or organization which is featured at the top of every article.


