 By Gail Krumenauer
Oregon Employment Dept.
Workforce
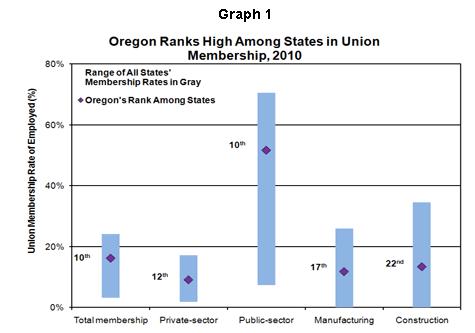
Oregon ranks high among the states in union membership. In 2010, Oregon had a 16.2 percent union membership rate of employed workers. This figure ranked 10th highest among the 50 states and District of Columbia. Private-sector union membership (9.1%) ranked 12th highest nationwide, and Oregon’s public-sector membership (51.7%) ranked 10th highest (Graph 1).
Oregon has relatively less union membership concentration in private manufacturing and construction than in the overall private and public sectors. In 2010, the union membership rate in manufacturing was 11.8 percent, 17th highest among the states. In construction, Oregon ranked 22nd (13.4% membership).
From 2009 to 2010, total union membership in Oregon fell to 245,100, a decline of 5,200 workers (-2.1%). Despite the overall losses, Oregon’s private sector saw an increase in union membership of 6,300 workers (5.8%) in 2010. The state’s public sector experienced a loss of 11,500 (-8.1%). The U.S. also saw declines over the year; total membership dropped by 4.0 percent to 14.7 million. Nationwide, both private- and public-sector losses occurred (-4.6% and -3.5%, respectively).
Employees who are not union members – but whose jobs are covered by union contracts – slightly increase the share of union coverage beyond membership rates in both the U.S. and Oregon. The total share of covered workers in the U.S. was 13.1 percent in 2010, 1.2 percentage points higher than the membership rate. Oregon’s 2010 coverage rate (17.7%) sits 1.5 percentage points above union membership.
Between 2009 and 2010, union coverage rates contracted at a slower rate than union membership. Nationwide, the share of covered workers declined by 3.6 percent over the year, 0.4 percentage point less than the membership decline. In Oregon, union coverage dropped by 1.6 percent or 0.5 percentage point less than the membership decline.
Historical Membership and Coverage Trends
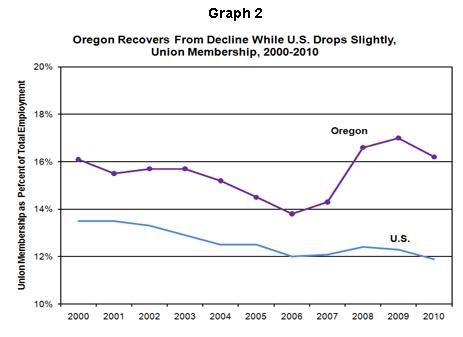
Between 2000 and 2010 overall union membership in Oregon grew by 10,700 (7.2%), driven by public-sector gains of approximately 17,800 members (21.5%). Although Oregon’s private-sector union membership increased from 2009 to 2010, the share has dropped by 7,100 members (-5.9%) since 2000.
Total U.S. union membership dropped by 1.5 million (-9.5%) from 2000 to 2010. Sharp declines occurred in the private sector (-2.1 million or -22.5%), while the public sector saw gains (512,600 or 7.2%) over the period.
From 2000 to 2010, union membership and coverage declines in the U.S. were similar (-9.5% and -9.2%, respectively). However, in Oregon, coverage gains (7.2%) exceeded membership increases (4.6%) by 2.6 percentage points.
Comparable union membership data are available back to 1983, when union membership totaled 17.7 million nationwide and 222,900 in Oregon. The U.S. has not since matched the 1983 membership level; the U.S. coverage rate also peaked in 1983 at 20.5 million. Oregon reached its 28-year membership (275,300) and coverage high (295,000) in 1994.
Metropolitan Area Comparisons
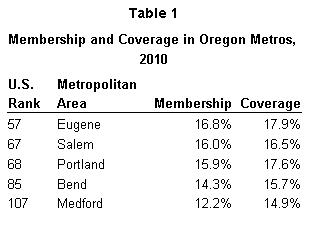
Information on total union membership is also available for 263 metropolitan areas nationwide, including the five largest Oregon metros. In 2010 Eugene had the highest estimated union membership of metro areas in Oregon (Table 1). At 16.8 percent, Eugene ranked 57th highest among metros nationwide. Oregon’s other metros also fell within the top one-half nationally for union membership. Salem had a 16.0 percent membership rate, followed by Portland (15.9%), Bend (14.3%), and Medford (12.2%).
The union concentration by total coverage changes the order of two metro areas. The union coverage rate in Portland (17.6%) puts the state’s largest metro area ahead of Salem (16.5%).
Disclaimer: Articles featured on Oregon Report are the creation, responsibility and opinion of the authoring individual or organization which is featured at the top of every article.


