![]() Reasons behind Oregon’s personal income rating compared to national average
Reasons behind Oregon’s personal income rating compared to national average
By Oregon Department of Employment
Oregon’s per capita personal income, the annual sum of all resident income in the state divided by the number of residents, was $36,125 in 2009. That’s 8.8 percent less than the national figure of $39,626. Oregon’s per capita personal income gap with the nation has generally been growing since 1996 and the growing gap concerns state policy makers and economists. Although there are many causes of Oregon’s low PCPI, there are no easy solutions to reduce the gap.
Significant causes of Oregon’s low per capita personal income relative to the nation likely include:
- Lower industry wages.
- Lower earnings by proprietors.
- A fast-growing population.
- Lower wages in high-paying occupational groups.
- A net outflow of commuter wages.
- Higher unemployment rate and lower employment-to-population ratio.
- Shorter average workweek and more part-time work.
Defining Per Capita Personal Income
Total personal income includes three major components:
- Net earnings by place of residence (examples: wages and salaries, employer contributions to pensions and insurance, proprietors’ income)
- Dividends, interest, and rent (examples: interest income, corporate dividends, rental income)
- Personal current transfer receipts (examples: retirement and Medicare benefits, income maintenance programs, unemployment insurance benefits)
The $138.2 billion total personal income received by Oregon residents in 2009 is simply divided by the 3.8 million people living in Oregon to calculate the PCPI, which is shown in Figure 1.
| How is Oregon’s 2009 Per Capita Personal Income Calculated? | ||||||||
| PCPI = | Earnings by Place of Residence + Dividends, Interest, and Rent + Transfer Receipts |
|||||||
| Population | ||||||||
| $36,125 = | $83.1 Billion Earnings + $28.2 Billion Dividends, Interest, and Rent + $26.9 Billion Transfers |
|||||||
| 3,825,657 Oregon Residents | ||||||||
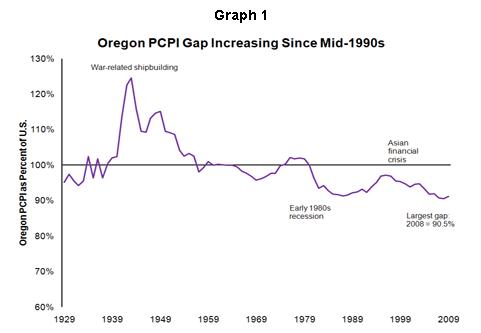
Oregon’s PCPI has grown over time, but like the nation, Oregon’s PCPI fell as a result of the recent recession. The fall followed inflation-adjusted peaks of $37,059 for Oregon and $40,839 for the U.S. in 2007. Oregon’s PCPI fell to 90.5 percent of the national level in 2008 – the largest gap between Oregon and the U.S. since estimates began in 1929.
Oregon’s PCPI was consistently above the national level from 1938 to 1956, when incomes were bolstered by defense manufacturing for World War II and the post-war economic boom. In 1943, war-related manufacturing propelled Oregon’s PCPI to 125 percent of the national level, the highest Oregon’s PCPI has ever been relative to the nation (Graph 1).
In the late 1970s, a booming manufacturing sector, including the important wood products industry, helped return Oregon’s PCPI to above U.S. levels between 1976 and 1979. The boom was relatively short-lived, and the national recessions of the early 1980s were especially tough on Oregon’s economy. Employment in wood products and construction was hit hard, and by 1982 the state’s PCPI fell to just 93 percent of the U.S. level.
After a decade of low PCPI, Oregon was bolstered by employment growth in construction, high-tech manufacturing, and growing trade with Asia. The gap in PCPI between Oregon and the U.S. was at its smallest point in recent years in 1996. Then the Asian financial crisis struck in 1997 and exports to Asia fell. At the same time, some high-paying industries like electronic instrument manufacturing and paper manufacturing began moving significant portions of their operations out of state.
The state’s PCPI growth was slower than the nation’s in 10 out of the 13 years since 1996, causing the gap to widen to its current level. Three factors seem to be the most significant contributors to Oregon’s growing gap with the nation: lower earnings, lower proprietor income, and fast population growth.
Net earnings by place of residence make up 60 percent of the “personal income” portion of PCPI. In 2009, Oregon’s per capita net earnings were $21,722, far less than the national average of $25,539 (Table 1). Oregon residents have done slightly better than the nation when it comes to dividends, interest, and rent and personal current transfer receipts, so the state’s lower earning have emerged as the major story in the state’s low PCPI.
A significant part of the gap in Oregon’s PCPI relative to the nation is due to industry wages. The majority of Oregon industries pay less than their national counterparts. If national wages could be applied to Oregon’s industry structure, the state’s gap with the nation would close by 3.5 percentage points.
Another factor contributing to Oregon’s lower earnings is the pay structure of Oregon’s occupations. Workers in the state’s lower earning occupations tend to be paid more than their national counterparts, and the occupational median wage is slightly above the national median, but wages in Oregon’s higher paying occupations lag behind the nation. For instance, wages for life, physical, and social science occupations in Oregon average about 83 percent of the national wage for these occupations. Similar trends hold for legal occupations, business and financial operations, management, and computer and mathematical science. Lower pay in these high-wage jobs contribute to lower industry wages.
Oregon also has more part-time workers and a shorter average workweek than the nation, two intertwined factors that also contribute to lower earnings. In 2009, Oregon had the highest rate of workers who usually work part time. Two-thirds of part-time workers were part time voluntarily. The other third were working part-time due to slack work or business conditions, an inability to find full-time work, or issues with child care.
Oregon’s high unemployment rate and many available workers put downward pressure on wages, leading to lower earnings and lower PCPI. Oregon’s unemployment rate has long been above the national rate, regardless of whether the economy is in recession or expanding. In 2009, Oregon’s average unemployment rate was 11.1 percent, compared with the nation’s 9.3 percent.
High unemployment in Oregon also contributes to a lower employment-to-population ratio, as do a higher portion of retirees, and a larger share of the population that chooses not to work. Oregon’s lower rate of wage earners in the population negatively impacts PCPI. Oregon historically had a higher employment-to-population ratio than the U.S., but between 1996 and 2009, Oregon’s ratio declined from 65 percent to 58 percent. While the U.S. employment-to-population ratio also declined during this period – from 63 percent to 59 percent – the U.S. now exceeds Oregon’s ratio by 1 percentage point.
| Components of Per Capita Personal Income, 2009 | ||
| Oregon | U.S. | |
| Net earnings | $21,722 | $25,539 |
| Dividends, interest, and rent | $7,366 | $7,143 |
| Personal current transfer receipts | $7,037 | $6,944 |
Proprietors make up a larger portion of Oregon’s total employment than is true for the nation, but Oregon proprietors earn less. Oregon proprietors earned just 72 percent of the earnings of their national counterparts. This earnings gap is not new. In all but one of the past 40 years, Oregon proprietors earned less than their national counterparts.
Proprietors’ income includes corporate directors’ fees, income from sole proprietorships, partnerships, and tax-exempt cooperatives. If Oregon proprietors earned the same income as the national average in 2009, Oregon’s total personal income would rise, and Oregon’s PCPI gap would narrow 2.5 percentage points.
It’s difficult to figure out why Oregon’s proprietors earn less. Part of the difficulty has to do with the estimation of proprietors’ income. Fifty-two percent of nonfarm sole-proprietors and partnership income is an income misreporting adjustment that tries to account for income that is not reported on tax returns. This is estimated nationally and distributed to states based on net receipts by industry. Other sources of proprietors’ income, such as inventory valuation and capital consumption are also estimated at the national level and distributed to states based on tax records.
Population is the “per capita” portion of PCPI, and Oregon’s fast population growth, coupled with average or below-average income growth, results in an increasing gap with the nation. Oregon’s population grew at a much faster rate than the U.S. since 1996. The state grew 18 percent while the nation grew 14 percent. Because population is the denominator of the PCPI formula, Oregon’s total personal income growth would have needed to grow at a much faster pace than the nation just to maintain the smaller PCPI gap that existed in 1996.
To the extent that people moving to Oregon are young adults early in their careers or retirees without wage income, the in-migrants would put downward pressure on PCPI. Oregon PCPI in recent years may have been “victim” of the state’s attractiveness, and a resulting population influx, particularly by those without incomes significantly higher than the Oregon average.
The relationship between population growth and economic growth is complex, but an overly simple calculation suggests that if Oregon’s total personal income grew as it did between 1996 and 2009 but the population grew at the same pace as the nation, Oregon’s PCPI gap would be 3.1 percentage points smaller.
As part of the PCPI estimate, the Bureau of Economic Analysis removes the earnings of residents who live in other states and work in Oregon. Their earnings are counted in their state of residence and these commuters have a downward effect on Oregon’s PCPI.
Out-of-state workers took home $2.4 billion in earnings more than Oregonians who work out of state were bringing back into the state in 2009, and these earnings were counted in the commuters’ home state. If the flow of commuter earnings in and out of the state were even, Oregon’s PCPI gap would be about 1.5 percentage points smaller.
Oregon, like 30 other states, has a PCPI level below the national PCPI. But in 2008 and 2009, Oregon had the 32nd highest PCPI of the states and D.C., the state’s lowest ranking since records start in 1929. Detailed comparisons with states that outperformed Oregon in PCPI, either by having higher PCPI or experiencing faster PCPI growth, show that in general, states with high or rapidly growing PCPI had:
- Much slower population growth.
- Faster growth in compensation per job.
- Concentration and growth in high-paying industries.
- Lower unemployment rates.
- Fewer part-time workers.
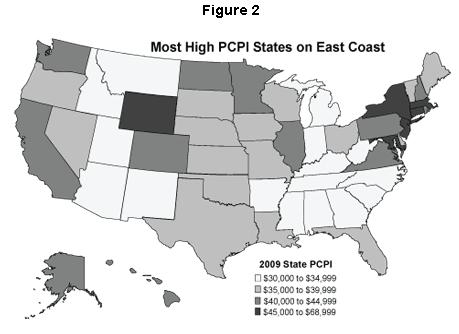
States with the highest PCPI levels are concentrated on the East Coast (Figure 2). These states differ from Oregon and the rest of the nation in their concentration of high-wage financial and insurance industries near New York, and professional and business services workers near the nation’s capital. Wyoming’s PCPI, the exception to the East Coast trend, benefited from rising energy prices during the last decade, increasing its PCPI rank from 20th in 2000 to 6th in 2009.
Oregon’s PCPI is affected by more factors than those mentioned here, but the relationships may not be as straightforward. A lower cost of living is one factor that is likely related to lower PCPI. A 2006 study by the Bureau of Economic Analysis suggests that Oregon’s lower cost of living could account for about one-third of the state’s gap with the nation.
Other factors, however, were looked at but not found to have much impact on Oregon’s PCPI. These include industry and occupational mix, the high minimum wage, federal government employment and spending, and the unionization rate.
Other factors are sometimes cited as influences on a state’s PCPI level but were beyond the scope of this analysis. These factors include the share of population with higher education, investment in education and infrastructure, and the tax structure. We leave it to experts in these fields to help enlighten Oregonians on the significance of each factor.
A more detailed look at the state’s per capita personal income gap can be found in the full report; Why Oregon Trails the Nation: An analysis of per capita personal income, available online at www.QualityInfo.org.
Disclaimer: Articles featured on Oregon Report are the creation, responsibility and opinion of the authoring individual or organization which is featured at the top of every article.


