By Tony Wendel
Oregon Employment Department
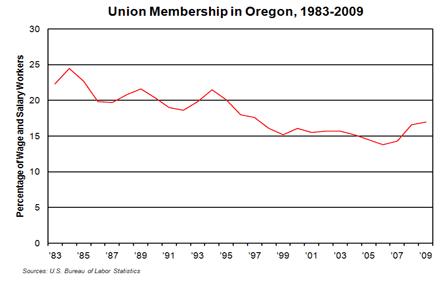
In Oregon, the union membership rate – the percent of wage and salary workers who were members of a union – rose slightly from 16.6 percent in 2008 to 17.0 percent in 2009. The rate increased even though the number of wage and salary workers belonging to unions decreased by about 9,000 (4%) due to a much larger decrease in the total number of wage and salary workers of about 95,000 (6%).
The small increase is calculated from data collected in a survey and may not be statistically significant. However, this marks the third consecutive year that the share of all workers who are union members has risen in Oregon. Since 1983, the first year for which comparable union data are available, the overall trend has been downward with brief upward ticks along the way, from a high point of 24.5 percent in 1984 to a low of 13.8 percent in 2006, just before the current 3-year rise (Graph 1).
A similar trend occurred in the share of workers – both union members and nonmembers – represented by union contracts. This share in Oregon was 27.9 percent in 1984, fell to 14.7 percent in 2006, and climbed to 18.5 percent in 2009. Over the 26-year period from 1983 to 2009, the overall declining rate of union-represented employment was caused by much greater growth in employment not represented by unions. Over that period, the number of workers who were union members or represented by unions increased by 4 percent from 262,000 to 272,000, and the number of workers who were not union members or represented by unions grew by 63 percent from 737,000 to 1,199,000.
In 2009, Oregon’s rates of union membership and representation were higher than those for the nation as a whole. Among our neighboring states, Oregon’s rates were lower than those in Washington, similar to those in California, slightly higher than the rates in Nevada, and more than twice as high as those in Idaho.
Union membership rates are much higher in the public sector than in the private sector. In 2009 in Oregon, more public-sector employees (152,000) belonged to a union than private-sector employees (120,000), despite there being almost five times more wage and salary workers in the private sector. Union members comprised only 8.9 percent of all private-sector workers but 57.7 percent of public-sector workers and 17.0 percent of both combined. For the nation, comparable figures were 7.2 percent, 37.4 percent, and 12.3 percent, respectively.
For more information, see www.bls.gov/news.release/pdf/union2.pdf and www.unionstats.com.
Disclaimer: Articles featured on Oregon Report are the creation, responsibility and opinion of the authoring individual or organization which is featured at the top of every article.


