Josh Lehner
Oregon Economic Analysis
Oregon’s income gains this expansion are among the best in the nation, as our office has highlighted in recent years. The state’s median household income now matches the U.S. for the first time since the mills started closing in the 1980s. The single largest factor underlying this growth is the strong labor market. For individuals and households in the middle of the distribution their primary and at times only source of income is wages. So the strong household income gains are driven by more Oregonians working more hours and at higher pay. The state’s average wage, while lower than the nation’s, is back to the same relative position as in the 1970s.
While all of these high level points have been well-covered, they do rely on medians and averages. We don’t look across the entire income distribution as often. So today I wanted to provide a few new and updated looks at the data to show how broad-based these gains have been.
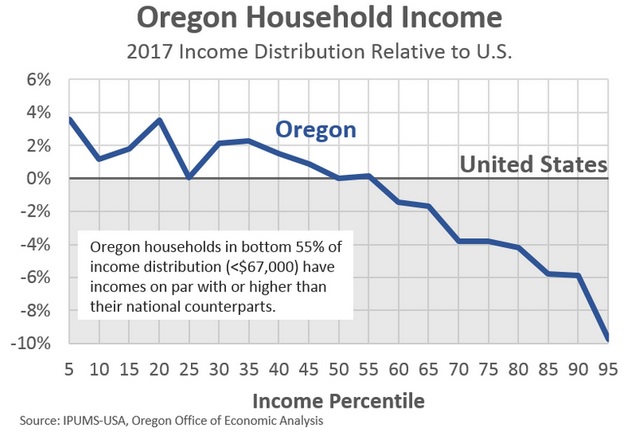
First, let’s compare Oregonian household incomes across the entire distribution to their national counterparts. In the latest Census data, Oregonians in the bottom 55% (or those with incomes of $67,000 or less) have similar or higher incomes than their national counterparts. Oregonian households in the top third and particularly the top 10% have lower incomes.
Now, one major factor influencing Oregon’s per capita personal income are the relative incomes at the very top of the distribution. Make no mistake, Oregon’s highest-income households have done well financially. But even in recent years, Oregon’s Top 1% or Top 5% of households have not closed the gap with their national counterparts. This gap among the richest households is large enough, and their incomes are high enough, to weigh on Oregon’s overall per capita personal income figures even as Oregonians in the bottom two-thirds of the distribution earn similar or higher incomes.
The good news here is that Oregon has seen broad-based gains in recent years. These improvements across the entire distribution have raised Oregon’s per capita personal income to it’s highest level, relative to the U.S., since before the dotcom crash in 2001. All of this despite the ongoing gap at the top-end.
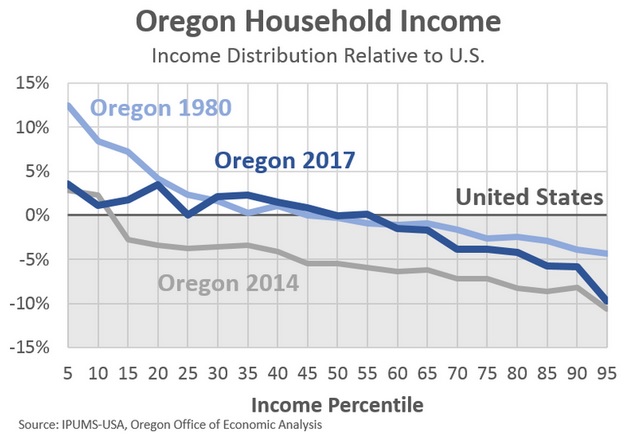
Next, given Oregon’s median household income today matches the U.S., I was curious how Oregon’s distribution looked the last time this was true, back at the 1980 Census. Same type of chart looking at Oregonians and their national counterparts across the entire distribution.
Four things stand out.
First, comparing the latest 2017 data to the last time we looked at this in 2014, you can see the broad-based gains in recent years. At all points in the distribution, Oregon’s gains have outpaced the nation’s. (Difference between gray and dark blue lines.)
Second, Oregonians in the 20th through 65th percentiles have the same exact relative positions today as back in 1980.
Third, national income gains for the lowest-income households have outpaced Oregon gains during this time, but Oregonians are still doing relatively better overall.
Fourth, the gap at the top-end of the spectrum has widened over time. As just mentioned above, this is the driver behind the per capita income trends. It is not about job growth or wages for the typical worker, but about relatively smaller gains for the very highest-income households. In part this reflects the fact that Oregon is not a financial center, nor do we have a lot of multinational headquarter operations.
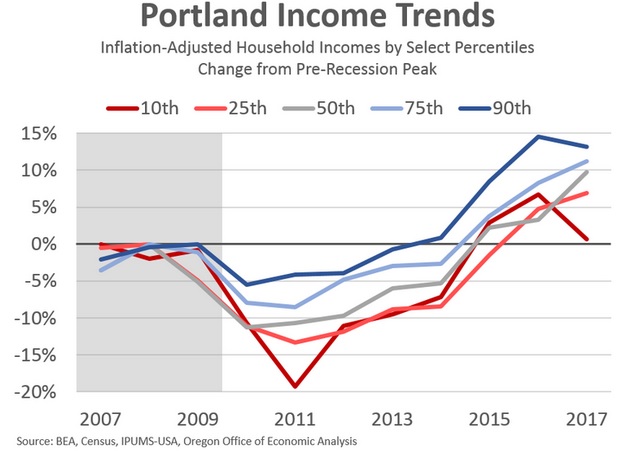
Finally, I was asked recently about income gains across the distribution in the Portland region. So I crunched some Census data and you can see the changes in the past decade for a few select percentiles. As expected, higher-income households have seen the biggest gains. This reflects the fact they saw fewer losses, but also enjoy a more diverse source of income in the form of wages, capital gains, investment properties and the like. We know that non-wage income growth has outstripped wage gains in recent decades. That said, households incomes across the entire spectrum are higher today in the Portland metro than before the recession even after adjusting for inflation.
Note that the decline in incomes at the 10th percentile in 2017 are also evident in the statewide data, as well as in Eugene. For now, given the ongoing strength in the labor market, this is likely an outlier data point that will be reversed when new data is released this fall. However we do not know for sure and this is something our office is monitoring closely.
I also took a similar look at other metros in Oregon, click on the links for the corresponding charts. In Bend incomes at all points in the distribution are back to pre-recession levels. In Eugene, incomes are up although we see declines at the bottom-end in recent years. Again, likely due to noisy data, but we shall see. And in Medford, where wage and income growth has lagged, we find incomes at the top rising quickly while all other points remain lower.
In terms of the outlook, expectations are for Oregon’s relative income positions to hold steady in the coming years. The primary reason for this is that Oregon’s average wages have already accelerated in recent years, even as U.S. wages have recently picked up. Our office expects Oregon’s average wage to continue to increase by 4 percent per year. However as the U.S. accelerates closer to Oregon’s annual rate, Oregon’s growth advantage in recent years will lessen.
Note that our office previously looked at wealth, its sources and implications, and a deeper dive into home equity gains in the Portland area. It’s been a few years since we last wrote about estate taxes here on the blog, so stay tuned for an update on that in the coming weeks.
Disclaimer: Articles featured on Oregon Report are the creation, responsibility and opinion of the authoring individual or organization which is featured at the top of every article.


