Timothy A. Duy
Director, Oregon Economic Forum
Department of Economics, University of Oregon
Below is the University of Oregon State of Oregon Economic Indicators for October 2018. The release date is December 6, 2018. Special thanks to our sponsor, KeyBank
The Oregon Measure of Economic Activity rose to 0.83 in October from an upwardly revised September reading of 0.76. Highlights of this month’s report include:
– The moving average measure, which smooths out the volatility, stood at 0.74, well above average (“zero” indicates average growth over the 1990-present period).
– Both the manufacturing and construction sectors made small positive contributions; hours worked in manufacturing continues to be a drag, but the fall in hours still looks to be more idiosyncratic rather than reflecting a shift in economic activity.
– The household sector continues to make a positive contribution; weakness in the stock market was a drag on the measure. Mixed results among the employment components left the services sector contribution at neutral for the month.
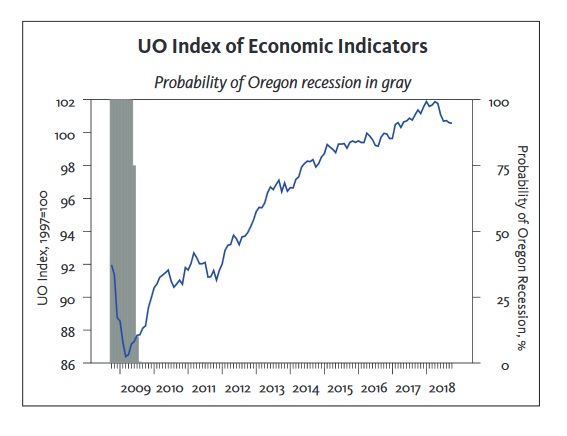
– The University of Oregon Index of Economic Indicators was flat in October. Like in September, most indicators held roughly steady during the month.
– Employment services payrolls (mostly temporary help jobs) climbed while initial unemployment claims remained low. Both indicators point toward continued job growth.
The decline in the UO Index in recent months is not sufficient to raise recession concerns. Together, these indicators still suggest ongoing growth in Oregon at an above average pace of activity.


Disclaimer: Articles featured on Oregon Report are the creation, responsibility and opinion of the authoring individual or organization which is featured at the top of every article.