By Josh Lehner,
Oregon Office of Economic Analysis
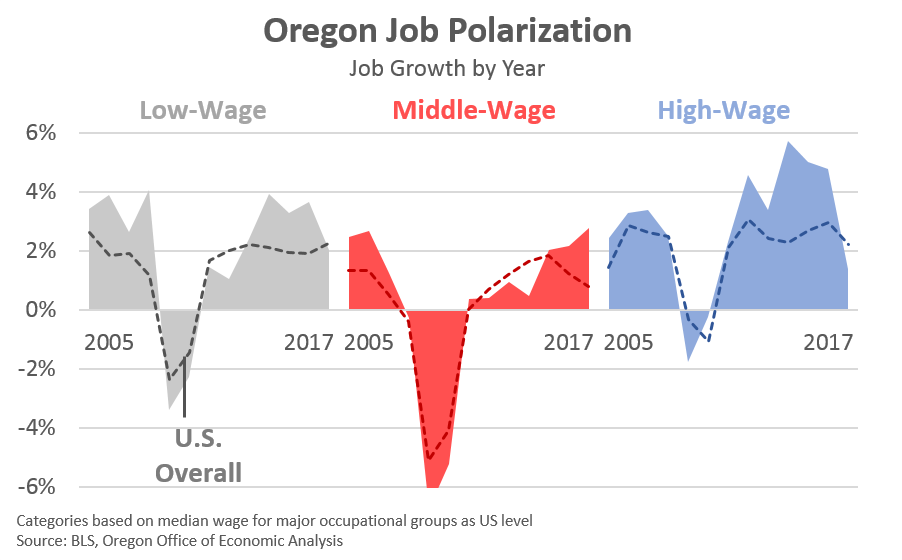
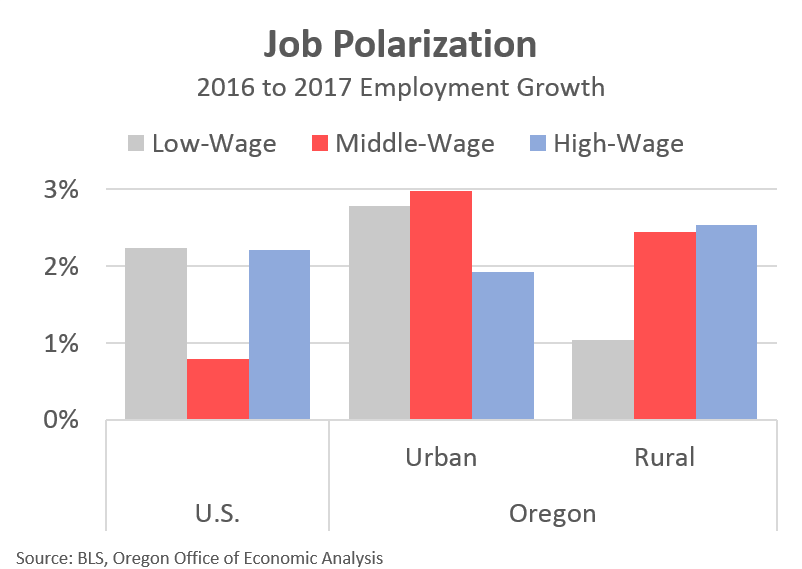
As the economic expansion matures and the labor market tightens, it brings along with it the feel-good part of the business cycle. Wages and household incomes are rising while poverty rates are dropping. Employment has picked up in rural areas even as it slows in the large, urban centers that turned around first following the recession. Additionally, employment prospects are up for all levels of educational attainment. Now, in keeping with this pattern we’re finally seeing good growth again among middle-wage jobs here in Oregon the past few years. No longer is the economy only creating high- and low-wage jobs like it was early in the recovery. In fact, according to the latest occupational data released last week by BLS, Oregon’s middle-wage jobs in 2017 grew at a faster pace (2.8%) than both high-wage (1.4%) and low-wage (2.0%) jobs. This marked the largest middle-wage increase in the past 15 years, just edging out 2006’s gains.
Importantly, this growth is not confined to the state’s metropolitan areas either. Both urban and rural Oregon saw strong middle-wage job increases last year.
The gains are fairly spread out across the middle-wage occupations, which pay roughly $35,000 – $50,000 for the typical worker in 2017. As we detailed in our office’s 2013 report, middle-wage jobs can be broken down into those which are more population-driven and those which are more business support.
As Oregon’s population growth picked up in recent years, it’s no wonder that we are seeing more community and social service workers, more educators, and more artists, designers, and entertainers. Additionally, along with a rising population we’re seeing more construction workers, and installation, maintenance, and repair workers as well. All of these occupational groups saw above average gains last year in percentage terms.
Middle-wage jobs that are more business support occupations, like production workers or office and administrative support staff, are those most impacted by technology and have seen the largest employment declines in recent decades. That said, these occupations are seeing some gains in recent years and they do not decline forever, even as this growth is harder to come by over time.
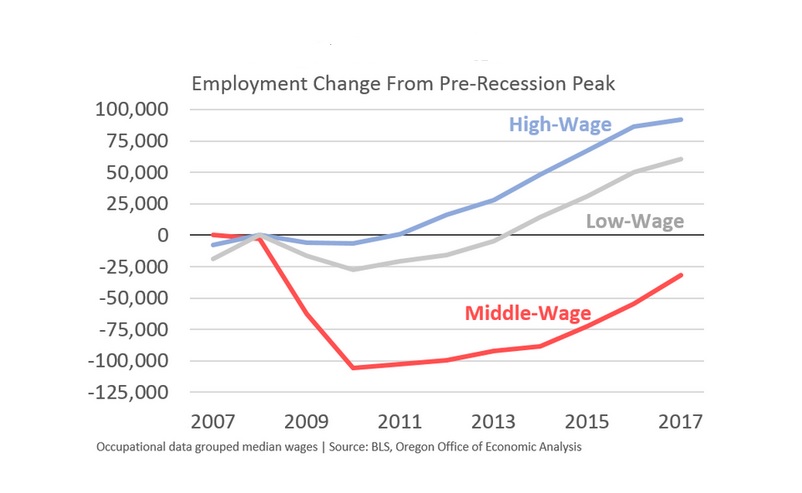
Now, even as growth picks up among middle-wage jobs, there are still fewer today than prior to the Great Recession. Over time these jobs make up a smaller share of employment as growth is concentrated, or polarized, in both high- and low-wage occupations. A few good years of gains, like Oregon has seen recently, does not change these big picture trends and issues, even if they should be noted and celebrated.

Finally a couple of notes on data and methodology. The specific data used here comes from the BLS’ occupational employment statistics (OES). This data really is designed to be a point-in-time estimate and not used to track changes over time. Furthermore, as our friends at the Employment Department note, this data is modeled, which means it uses information beyond just employment survey data. So why does our office, and both the New York and San Francisco Fed use it like we do?
First, these polarization trends are best viewed through the occupational lens. I cannot stress this enough. The issues and impacts of technological change are about the duties and tasks that workers perform. It is not confined to a specific industry or two. Rather these issues cut across all industries, particularly for things like office and administrative support jobs. Even in, say, manufacturing where we are seeing job growth, it is more about the non-production occupations (architecture and engineering, computer and math) than the actual production jobs which make the physical products.
Second, given the importance of occupational data to these issues, the OES data is the best readily available data we have. It’s not perfect of course. And one issue here are changing definitions over time, which can make historical comparisons problematic. Thankfully, many of these definitional changes are at the detailed, or individual occupation level, and not at the occupational group level. As such, definitional changes are less problematic for much of the polarization research, although they are not entirely benign.
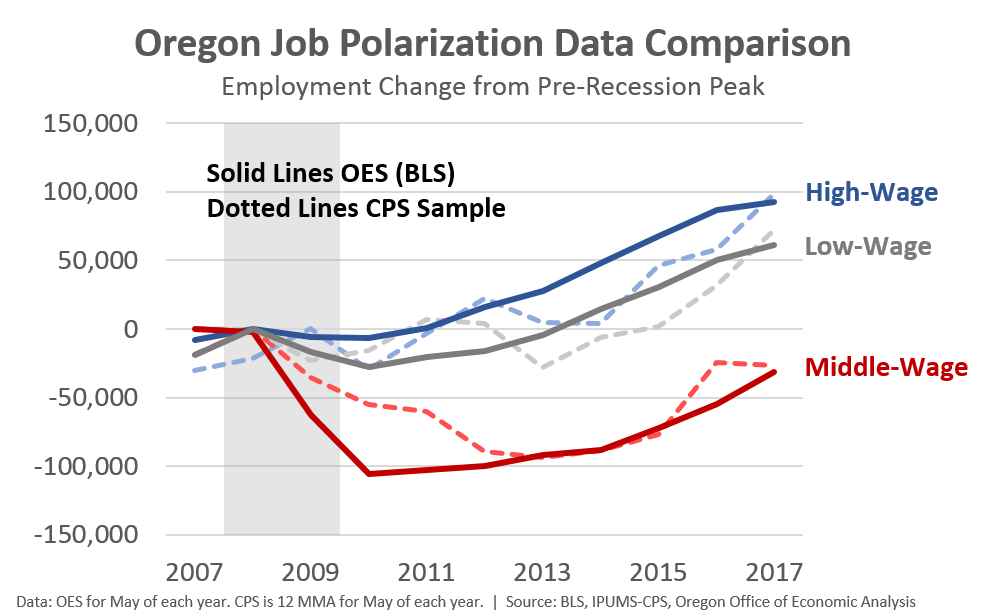
Third, even if you look at consistently-defined occupations over time, like the good folks at the University of Minnesota create, the same trends are evident. The year-to-year fluctuations are different of course, however over the past decade the underlying household survey data and the OES data are nearly identical.
Bottom Line: The economic expansion has reached all corners. The feel-good part of the business cycle is clearly here. We’re finally seeing some good growth among middle-wage jobs again. This is at least in part due to our stronger population gains. The near-term outlook remains bright, barring an international trade war. Over the long-run, however, middle-wage occupations are still expected to comprise a smaller share of the economy due to shifting workplace practices and technological change. High- and low-wage jobs will continue to lead growth in the future.

Disclaimer: Articles featured on Oregon Report are the creation, responsibility and opinion of the authoring individual or organization which is featured at the top of every article.