Labor Supply, How Much More?
By Josh Lehner
Oregon Office of Economic Analysis
Right now we know the labor market is tight. Help Wanted signs and media reports of businesses saying they can’t find enough workers are a daily occurrence. Standard economic measures like the unemployment rate agree. If Oregon is to see stronger labor force growth, or labor supply, it will have to come from some combination of faster population growth and/or higher labor force participation rates among Oregonians. The question is: will we get it?
Our office recently asked our advisors about this. Our baseline outlook says the slower job growth we’ve seen in the past year is here to stay and much of the participation gains have played out. We feel strongly that this is the most likely outcome, however there is upside risk here too. Job growth, labor force participation, and population growth can all come in better than we expect. Even in a world with a kicker law, better economic growth is a good thing.
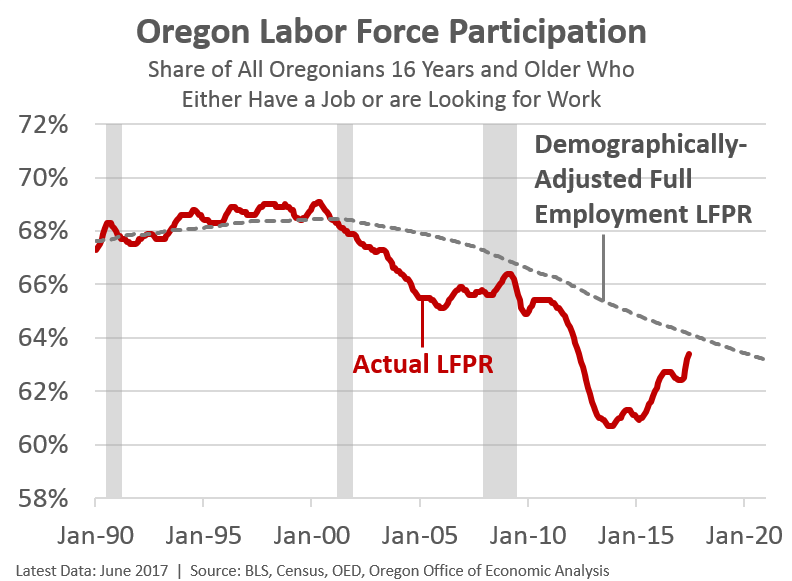
First, however, it must be highlighted that Oregon already has a good labor force response. A lot of Oregonians are back in the workforce in search of the more-plentiful and better-paying jobs in recent years. While it is true the labor force participation rate remains lower today than a decade or two ago, much of the decline is due to the aging population. The participation gap — the difference between the actual LFPR and an estimate of what it s/would be at full employment — is essentially as small today as at any point since the dotcom bust. Can we do better?
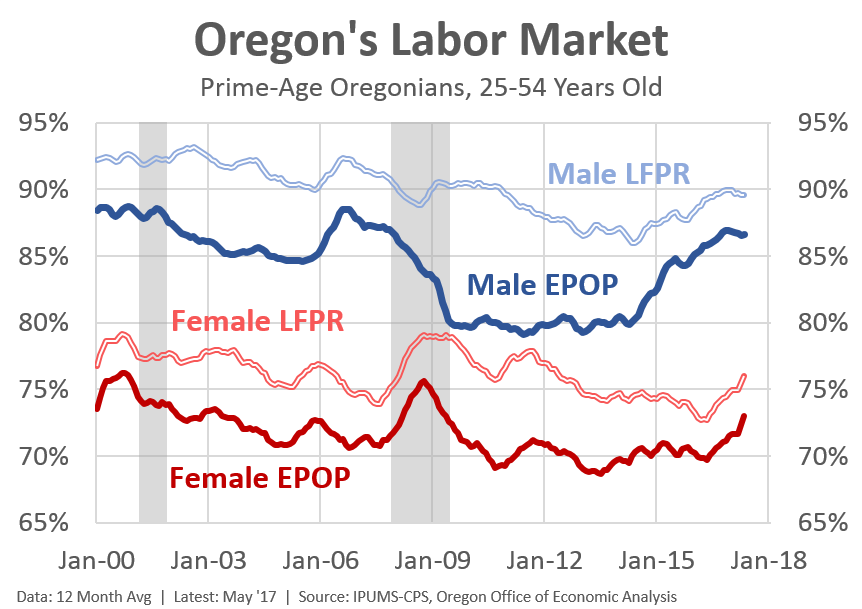
Changes over the past 20 years vary considerably by age group. However economists tend to focus on the so-called prime working-age population, 25 to 54 years old. This group is less prone to changes in higher education enrollments (unlike 18-24 year olds), or retirement decisions (unlike 55+ year olds). However, participation rates even among these prime-age Oregonians have fallen. See our previous reports on prime-age men and prime-age women for more on educational attainment and middle-wage jobs.
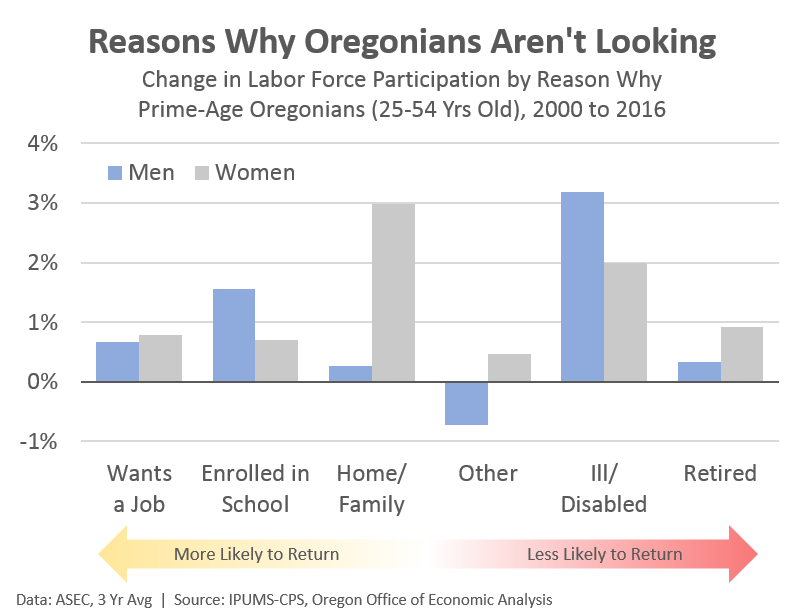
Everything else equal, fewer available workers does represent lower potential economic growth moving forward. So a key question is why are participation rates down? What are these prime-age Oregonians doing instead of looking for work? The chart below shows the relative shift (increase) for each reason folks are not in the labor force since 2000, the last time the economy as at, or beyond, full employment.
Keep in mind that while labor force participation is a yes or no question on paper and in the data, it really operates on a continuum. There are a lot of factors that go into the decision. It is not truly black and white. What if a job offer came it at $2/hr more? $5/hr more? What if a slot opened up at the neighborhood childcare center making it easier to drop off and pick up your kid(s)? What if the company on the bus line had an opening? And so forth.
Similarly, the reasons why people say they are not looking for work imply different outlooks for future growth too. More-plentiful job opportunities are likely to pull discouraged workers back in who previously gave up looking. Those enrolled in school will return when they graduate. However those in bad health may be unable to return to the workforce even if they want to. Those saying they are retired may be less likely to rejoin as well.
Nonparticipation rates are up across the board, in all age groups (except 65+), for both sexes, and for all types of reasons. That said there is important variation. Higher ed enrollment is more pronounced among the 25-34 year olds (and 18-24). The increase in stay-at-home moms is also among the younger group. While the increase in the ill or disabled are most pronounced among the older prime-age group (45-54).
In looking at the chart, going from more likely to return to the labor force to less likely, it’s easy to see another percentage point or two increase as reasonable. More is possible, but then you get further into the gray areas. Now, the data above is lagged and uses a multi-year average to help with sample size concerns. Real time participation data indicates Oregon has already seen some additional gains. Employment and participation is now close to where it was a decade ago, however further gains are needed to return to late 1990s rates.
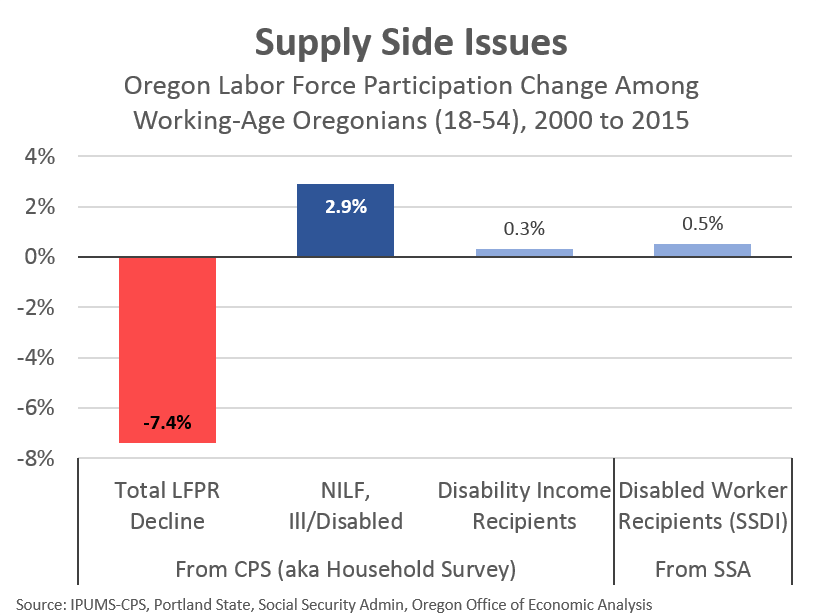
Finally, the big increase in those saying they are too ill or disabled to work is a big concern. Does it represent a major public health issue, possibly even linked to the opioid crisis? Does it simply reflect larger societal acceptance/acknowledgement of chronic pain? Does it represent individuals trying to save face when asked why they aren’t working? Or does it represent an increase in those claiming disability for financial reasons and benefits?
It is hard to pin down the exact reasons. However we can largely rule out disability benefits as the driver. As an economist, it’s clear that incentives matter. By paying some people to not work (because they are unable to do so), there is an incentive to apply for and receive disability benefits. However, when digging into the data, it is clear that the increase in those actually receiving disability income and those actually part of the Social Security Disability Insurance Program is considerably smaller than the overall increase in people citing ill health or disability as the reason they are unable to work. Now, it is one factor, one component of these trends, however it is clearly not the major driver.
Note: Our office is working on some opioid-related work. Hopefully it will be ready in the not-too-distant future to discuss.
Summary: While our office expects the slower job growth to continue, it does not mean the numbers cannot come in better than we expect. Some slack remains. Should a stronger economy pull more workers back into the labor force it would be great news.


Disclaimer: Articles featured on Oregon Report are the creation, responsibility and opinion of the authoring individual or organization which is featured at the top of every article.