By Josh Lehner
Oregon Office of Economic Analysis Blog
One of the defining features of the Great Recession is the housing bubble that preceded it and set the stage for the collapse. The regions of the county that experienced the biggest bubble, also experienced the largest fallout when it burst.
One item our office has tracked over the years are the Housing Bust Metros which are the 50 metros with the biggest run-up in prices and subsequent declines, per the FHFA home price data. While much of the focus of the housing bubble was on the so-called sand states (AZ, CA, FL, NV) which experienced tremendous bubbles, unfortunately, two of the nation’s largest bubbles were here in Oregon. Bend and Medford’s experiences are right there with the worst of the worst in terms of the bubble and bust. In short, that’s not good.
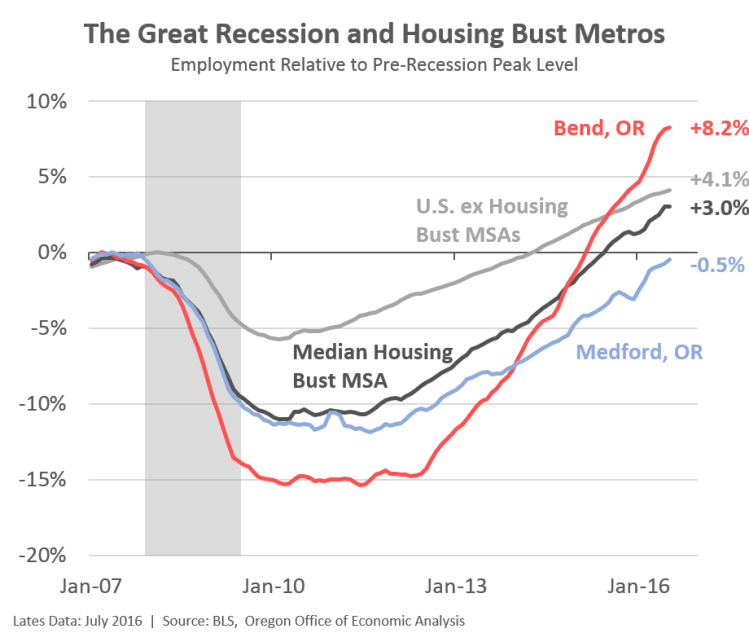
In terms of the economic fallout, only 1 percent of the nation’s metros overall saw larger employment declines than Bend experienced and only 7 percent saw worst declines than Medford. This is certainly part of the story for why Oregon’s Great Recession was worse than the nation overall, besides our general volatility due to industrial structure and migration flows. And when a region suffers a decline like Bend and Medford a few years ago, it does not bounce back right away. The only thing comparable to these losses in Oregon’s modern history is what happened to Coos Bay in the 1980s. So, it takes awhile to adjust and recover. We know both Bend and Medford are growing again. Bend is off like a rocket once more, adding jobs at a 6-8 percent annual pace in recent years. Medford is seeing solid growth, if not spectacular.
All of this brings us to this edition of the Graph of the Week. A simple update to our housing bust metros graph. The typical housing bust metros saw employment declines that were twice as large as the rest of the nation. Medford was a little worse than that while Bend’s decline was nearly three times the rest of the country. In recent years, the housing bust metros have added jobs at a faster pace and are making up lost ground, even if that gap has not fully closed as of this summer.
When looking at all the various housing bust metros, it is not true overall that the farther you fell the stronger your rebound. This was clearly not a V-shaped recovery. In general, the farther you fell during the bust, the slower and weaker your recovery. There are a few exceptions here that have shown tremendous growth despite the severity of the recession. These outliers include Bend, in addition to both Cape Coral, FL and St. George, UT. Medford for it’s part is outperforming around 1/3 of these housing bust metros and has essentially regained all of its lost jobs today. While a bit slower than typical/historical growth in Medford, this performance outpaces the rest of the State of Jefferson. Stay tuned, I will have an economic update on the State of Jefferson in the near future.
Disclaimer: Articles featured on Oregon Report are the creation, responsibility and opinion of the authoring individual or organization which is featured at the top of every article.


