![]()
By Josh Lehner
Oregon Office of Economic Analysis Blog.
This post is excerpted from the Western Section of the December 2012 Economic and Revenue Forecast document. For a more complete discussion surrounding the material, please refer to the full document.
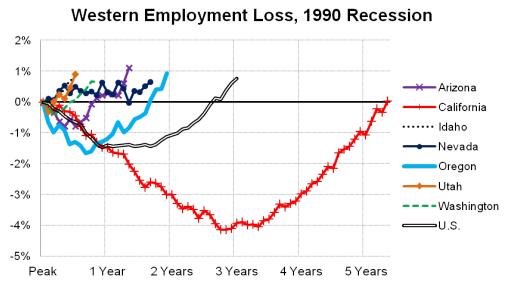
The following employment graphs show the depth of job losses in each state and how long it took for each state to regain those losses.
Overall, the time period from 1990 through today for Western states has been largely characterized by strong growth, both in terms of employment and population, relative to many other regions of the country. It certainly is true that the U.S. and the West Coast states – California, Oregon and Washington – experienced no net employment gains over the most recent decade, as it was bookended by two recessions. However, the (generally) smaller Western states – Arizona, Idaho, Nevada and Utah – did add jobs on net over the decade, fueled by high rates of population growth.
The 1990 Recession:
The 1990 recession is considered mild by historical standards and that certainly applies to many of the Western states. Two of the industries which were most affected by the downturn were old-line manufacturing (e.g. textiles) and military, due to the base closures. Neither of these two industries or events was particularly pronounced among Western states as seen in [the top panel in the graph below] which plots employment losses during this time period. California is the exception and quite the exception at that. Base closures led to falling house prices in California, which were unheard of at that time.
The 2001 Recession:
The tech recession or dotcom recession are also common names for the 2001 recession as it was characterized by the buildup of high technology companies, products and stock prices throughout the late 1990s. When the stock market crashed, the resulting economic downturn was again relatively mild from an historical point of view at the national level, however not so on the West Coast. [The middle panel in the graph below] compares employment losses across the Western states during this period.
The 2007 Recession:
The 2001 recession did have an asset bubble component to it as the price of technology stocks soared and crashed, however for most individuals it was much more a financial shock on paper, or in terms of the value of their financial assets. The 2007 recession, also referred to as the Great Recession, had an asset bubble in real estate prices that helped fuel consumer spending (debt) during the previous expansion that ultimately resulted in a global financial crisis when it burst. Needless to say, the Great Recession was not mild by historical perspective like the previous two recessions in the U.S. The depth of the recession in each state, in terms of employment loss or increase in the unemployment rate, can best be thought of relative to the size of the preceding housing bubble. As recent research by the Federal Reserve Bank of San Francisco confirms, job losses mirrored the housing bust at the state or local level.

Beyond just comparing employment losses, the forecast document examines state level recession probabilities and dating local business cycles.
While the National Bureau of Economic Research (NBER) is the official purveyor of determining and dating U.S. business cycles, no such organization exists for state level recessions. While gauging the health of a local economy is important for both business and policy planning purposes, understanding when and why economies fall into recession is a more complicated matter, particularly in real time analysis that lacks the benefit of hindsight.
…
Even after examining the data, determining and dating each state’s business cycles can be complex. Luckily, Jeremy Piger, an associate professor of economics at the University of Oregon, has developed a model that calculates the probability of recession and can be used to date state level business cycles. Using Professor Piger’s model, the Oregon Office of Economic Analysis ran each Western states’ coincident index through the process and the resulting probabilities of recession for each state can be seen in [the graph below.] Overall, the results are generally the same as discussed previously given that the coincident indexes are best thought of as labor market indexes, however, they provide a more complete picture as they include both hours worked and wages and salaries.

Please refer to the forecast file for more details on these calculations and a more complete discussion.

Disclaimer: Articles featured on Oregon Report are the creation, responsibility and opinion of the authoring individual or organization which is featured at the top of every article.