 Oregon Jobs in 2011: A wage data perspective
by Barbara E Peniston
Oregon Employment Department
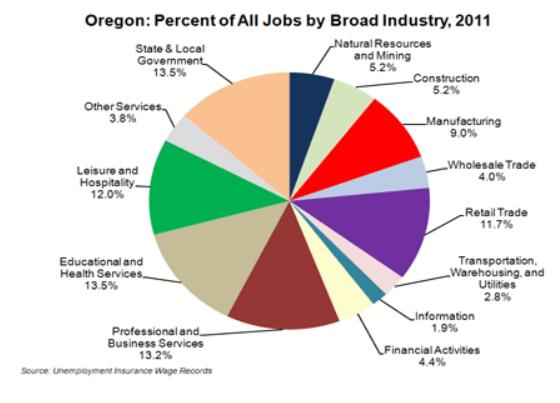
In 2011, all broad industries provided 2,449,826 jobs, a loss of 89,994 (3.5%) from the prior year. Between 2010 and 2011, five of 12 broad industries experienced a decrease in the number of jobs. Leisure and hospitality suffered the largest absolute loss (91,931 jobs) and the largest percent decrease (23.8%). Professional and business services (which includes temporary help businesses) experienced the largest absolute gain (16,368 jobs) and the largest percent increase (5.4%).
The largest number of jobs (329,234) was held by state and local government workers in 2011. Their share of the jobs pie rose from 13.1 percent in 2010 to 13.5 percent in 2011 (Graph 1). Education and health services was a very close second, capturing 329,159 jobs that year. Year over year, state and local government lost 3,015 jobs and education and health services gained 7,799. Together, manufacturing, financial activities, and retail trade shed 32,620 jobs. The construction and natural resources industries, which lost jobs during the previous year-over-year period, gained 5,657 and 4,100 jobs, respectively.
The median hourly wage of jobs in all broad industries rose from $14.79 to $15.16 per hour in 2011 – a year-over-year increase of 2.5 percent – which offset the $0.21, or 1.4 percent loss, between 2009 and 2010. Information continued to have the highest median hourly wage at $25.00. Construction ($22.55) and state and local government workers ($21.95) also had relatively high median hourly wages. The leisure and hospitality industry remained at the bottom of the stack in 2011, with a median hourly wage of $9.70. All broad industries except retail trade and transportation, warehousing, and utilities saw increases in their median hourly wage that year.
Roughly 20 percent of all jobs in 2011 paid at least $30.00 per hour and more than one-third paid at least $20.00 per hour. About half of all jobs paid less than $15.00 per hour, almost 2 percentage points lower than in 2010. The vast majority of the over-the-year job losses were concentrated in the smallest hourly wage classes (Table 1); in fact, nearly 108,000 jobs paying less than $20.00 per hour were lost in 2011. This is not surprising, given the concentration of job losses in leisure and hospitality. In general, the smaller the hourly wage class, the larger the number and percentage of job losses. Jobs were gained in all wage categories of $30.00 per hour and above.
To see detailed annual tables, visit www.QualityInfo.org and go to the Wages and Income link to find Quarterly Wage Tables.
| Oregon: Year-Over-Year Job Losses/Gains | ||
| by Hourly Wage Class, 2011 | ||
| Percent | Jobs | |
| Under $10.00 | -10.6% | -67,156 |
| $10.00 – $14.99 | -3.4% | -22,247 |
| $15.00 – $19.99 | -4.6% | -18,347 |
| $20.00 – $29.99 | -0.1% | -482 |
| $30.00 – $39.99 | 0.4% | 795 |
| $40.00 – $49.99 | 5.8% | 6,254 |
| $50.00 – $59.99 | 8.2% | 4,679 |
| $60.00 or more | 6.9% | 6,510 |
| All Wage Classes | -3.54% | -89,994 |
| Source: Unemployment Insurance Wage Records
|
||
Disclaimer: Articles featured on Oregon Report are the creation, responsibility and opinion of the authoring individual or organization which is featured at the top of every article.

