Josh Lehner
Oregon Office of Economic Analysis
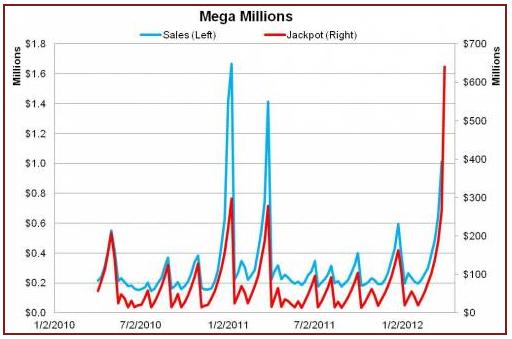
I am currently working on a paper that discusses the Oregon Lottery for an upcoming conference so this work dovetails nicely with the current $640 million record jackpot for Mega Millions…Overall the sale of tickets for these jackpot games (Powerball, Mega Millions and Oregon’s Megabucks) are predominantly driven by the jackpot level itself, a big surprise, I know. If you run a simple regression of sales on jackpot levels, the jackpot itself explains approximately 80 percent of the variation in sales. Given that the sales are autocorrelated during the jackpot cycle, including a first-order autoregressive term raises the explanatory power to around 90 percent. We include a few other variables in our equations (including the jackpot level of the other jackpot games – to account for the cannibalization of sales for a particular game during a run-up) and arrive at a final explanatory power of approximately 95 percent. The graph below shows weekly Mega Millions sales in Oregon in blue on the left axis and the corresponding jackpot level in red on the right axis. Clearly the sales follow the jackpots.
There are a few interesting facts regarding Mega Millions in Oregon. Given that the game is still relatively new to the state (only began selling in late March 2010), it appears to be a little more sensitive to the jackpots than the other, more established, games in Oregon (Powerball and Megabucks).
Given that the total amount spent (sales) on jackpot games in Oregon has remained relatively stable over the past handful of years (once you smooth the data to account for run-ups), the introduction of Mega Millions does not appear to have increased the size of the pie, so to speak, and an examination of the data reveals that both Powerball and Megabucks have lost some market share.
Now, what does the model predict for sales given the record jackpot? Two factors make it is a little tough to tell specifically given that the jackpot level is the largest in history – meaning we are off-model or out-of-sample here – and the fact that our models are weekly sales models and this jackpot is only for one particular day/drawing. Typically averaging the jackpot levels for the two weekly drawings does not create problems and yields reliable results, however with record levels it may become more of an issue. To this end I have run the model under a few different scenarios to try and gauge the range of outcomes. First the high end estimate, if you use our Mega Millions model and plug in a value of $640 million for the weekly jackpot level, the result is 6.8 million tickets sold. If you were to average the two jackpots for this week ($363 million on Tuesday, $640 million on Friday), per our standard methodology, the result if 4.6 million tickets sold. Given that the previously largest weekly level of sales in Oregon for Mega Millions was 1.7 million, we are clearly in uncharted waters in the state. With that being said, weekly Powerball sales in Oregon have routinely topped $2 million if the jackpot gets large enough and have reached around $4 million in both 2007 and 2008. Note that Powerball sales are more complicated given the powerplay option. All told, I would place a conservative estimate of sales at 4 million (certainly for the week as a whole this is very conservative) and believe the 6.8 million is a reasonable upper bound. What makes this level of sales interesting is that the total population of Oregon is 3.8 million in 2011, meaning the number of tickets purchased this week will outnumber every man, woman and child in the state.
Finally, what happens if an Oregonian won the jackpot? According to the Mega Millions website, the cash option is worth $462 million. Applying the top marginal tax rate at both the federal and state levels would leave the winner with a net $255 million, assuming a very simple tax return. The state would receive approximately $45.7 million under this scenario. The annual payment option would be $24.6 million per year for 26 years.
Anyway, the nuances and data of jackpot games is an interesting topic. Once complete, I plan on posting the conference paper online and will most likely write a short summary post.
Disclaimer: Articles featured on Oregon Report are the creation, responsibility and opinion of the authoring individual or organization which is featured at the top of every article.


