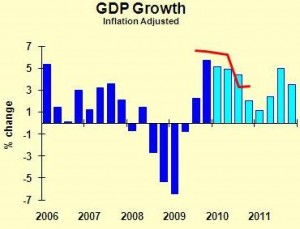
I just updated my economic forecast, taking into account the new GDP data released by the government last week. Fourth quarter growth came in stronger than I had expected–and everyone has been telling me I’m an optimist!
Here’s how the new forecast looks:
The dark blue columns are actual data (though subject to revision by the government), and the light blue columns are my forecast growth rates. The red line is the average growth rate of all the post-World War II recoveries. I’ve posted information showing that typically, more severe recessions result in stronger economic recoveries. So any forecast underneath that red line is being very conservative.
A key driver of the turnaround in growth is the inventory swing. The latest GDP numbers show a faster recovery of business equipment spending, consistent with reports from high tech companies (such as Cisco’s recent sales and earnings report). I had expected more of a post-cash-for-clunkers slump in consumer spending than we actually got, suggested a bit more resilience out there.
Every time I release a forecast that is not totally doom and gloom I get mail from folks reminding me of the deficit, bad policy, high unemployment, etc. I suggest that you extreme pessimists pull data on the long-term growth of the economy, and then argue that the problems we have now are worse than the Civil War, Great Depression, dismantling of the British Empire, World War II, and rise of disco music.
Disclaimer: Articles featured on Oregon Report are the creation, responsibility and opinion of the authoring individual or organization which is featured at the top of every article.


