By Oregon Employment Department,

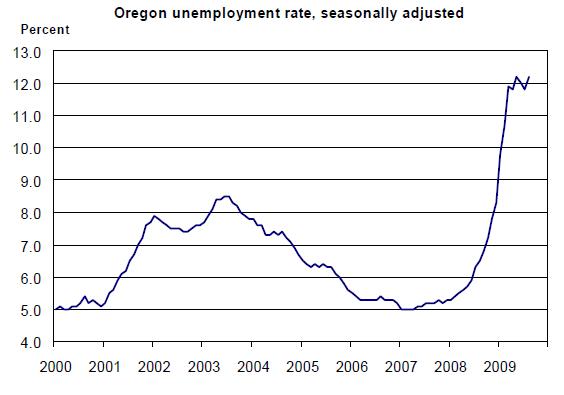
Oregon’s seasonally adjusted unemployment rate rose to 12.2 percent in August from the revised July figure of 11.8 percent. Oregon’s unemployment rate has been close to 12 percent for the six month period March through August, following a steep run-up during the prior nine months. Oregon’s unemployment rate was 6.5 percent in August 2008.
– The U.S. seasonally adjusted unemployment rate rose from 9.4 percent in July to 9.7 percent in August, its highest level in 26 years.
– In August, Oregon’s seasonally adjusted nonfarm payroll employment declined by 6,600 jobs, following a gain of 500 (as revised) in July.
Industry Payroll Employment (Establishment Survey Data)
In August, four major industries posted seasonally adjusted job losses: leisure and hospitality ( 2,300), government (-2,000), professional and business services (-800 jobs), and educational and health services (-800). None of the other major industries posted significant changes.
While seasonally adjusted nonfarm payroll employment dropped sharply in August, by 6,600, there was positive news in the goods producing sector. The long-term slide in employment in both construction and manufacturing at least temporarily halted. Both of these two major industries performed roughly in line with their normal seasonal pattern. And the revisions to these two industries for July data show that the originally reported losses in July were not as substantial as initially estimated.
Leisure and hospitality saw the peak employment month of the year come in under 173,000 compared with 181,700 in August 2008. The most recent monthly tally was down from the July figure by 1,000. Arts, entertainment, and recreation was hit with a loss of 1,100 in August. Elsewhere in the broader industry, full-service restaurants cut 400 jobs in August and is now down 5,100 jobs or nearly 8 percent over the year. Underscoring the notion of consumers eschewing luxury goods in favor of cost-conscious alternatives, limited-service eating places added 1,000 jobs in August and now is down only 500 jobs, or less than 1 percent, since August 2008.
Government cut 3,500 jobs at a time of year when a loss of 1,500 is the normal seasonal pattern. Federal government cut 300 jobs, but is still up 600 from its year-ago figure. State government was essentially unchanged over the month and over the year. Local government, then, has been the main driver of government’s recent trends.
In July, local government spiked upward on a seasonally adjusted basis as local education started the summer break a bit higher than expected. Then in August, local education dropped down further than normal for the month. In August, local education reached 83,500, which was essentially at the same level as in August 2008.
Indian tribal employment was 8,500 in August, which was 700 below its year-ago figure. The tribal casinos, restaurants, and accommodations are feeling the effects of the recession.
Professional and business services has shown a downward trend over the past 12 months, shedding more than 17,000 jobs or nearly 9 percent in that time. After a flat trend in the spring, by August, the decline resumed, with a loss of 800 jobs on a seasonally adjusted basis.
Educational and health services posted a rare seasonally adjusted job loss in August, cutting 400 jobs at a time of year when a gain of 400 is the norm. Longer term, the industry is still on the uptrend, having added 5,600 jobs or 2.6 percent to its workforce over the past 12 months. Two component industries have held back health care recently. Ambulatory health care services is down 800 jobs since August 2008, while social assistance is down 900 over that time.
Unemployment (Household Survey Data)
In August, Oregon’s seasonally adjusted unemployment rate was 12.2 percent, four-tenths of a percentage point above the revised July figure of 11.8 percent. The rate has been within two tenths of a percentage point from 12 percent since March.
Since August 2008, the number of Oregonians unemployed has risen by 109,141. Most of the increase was due to the loss of jobs, as employment is down 104,678 during that 12-month period.
Apart from the drop in the employed and the sharp increase in the number of unemployed, the labor force has shown a trend not seen in more than a decade. During July 2008 through April 2009, Oregon’s seasonally adjusted labor force grew very rapidly, increasing by more than 52,000 individuals or 2.7 percent. Then from April through August this measure of the labor force declined by more than 36,000 people, putting the labor force just slightly above its August 2008 total. Reasons for the declines in Oregon’s labor force over the past four months are unclear at this time.
In August, 235,745 Oregonians were unemployed. In August 2008, 126,604 Oregonians were unemployed.
The Oregon Employment Department plans to release the August county and metropolitan area unemployment rates on Monday, September 21st and the statewide unemployment rate and employment survey data for September on Monday, October 12th.
— end —
For the complete version of the news release, including tables and graphs, visit: www.QualityInfo.org/pressrelease.
For help finding jobs and training resources, visit one of the state’s WorkSource Oregon Centers or go to: www.WorkSourceOregon.org.
Equal Opportunity program — auxiliary aids and services available upon request to individuals with disabilities.
Disclaimer: Articles featured on Oregon Report are the creation, responsibility and opinion of the authoring individual or organization which is featured at the top of every article.

