 [5]
[5]
By Josh Lehner
Oregon office of Economic Analysis,
This morning the Census Bureau released the 2021 American Community Survey data. This is the best data set available to researchers as it provides not just high level measures looking at income, poverty, employment, commuting, housing and the like, but also the socio-economic characteristics of these measures as well. Importantly the 2021 data is a return to official Census estimates, whereas the 2020 numbers were “experimental estimates” due to low survey response rates. Today we will highlight just a couple important things, and in the months ahead we will dig further into the data and post updates on key topics.
If we step back and think about 2021, it’s a very strange year. We began the year in full pandemic mode, takeout only restaurants, a deep economic hole, and recovery rebates. We ended the year having added 100,000 jobs in Oregon, a tight labor market, and fast wage growth. It truly was a year of massive change from start to finish. It’s important to keep this in mind because the ACS is what’s called a continuous survey. This means there are always surveys going out to Oregonians. As such, you get some responses in January, some in February, some in March and so forth. So when we take all of that and average it together to talk about 2021, it’s a little funky. I suspect as we dig deeper into the data, some of that funkiness will surface, but for now let’s look at income and poverty in the state.
First, I need to put a disclaimer up front. I am not 100% sure how the recovery rebates are treated in the data. The income data are self-reported. There is a question about total income and then different types of income including wages, business income, etc but there is a public assistance one. So in theory recovery rebates could be included (and in practicality in terms of household finances, I think they are important) but the rebates were also essentially advanced tax refunds, so not technically more income but rather less tax owed. I am still digging into this and trying to figure it out. With that said, on to the tables published this morning.
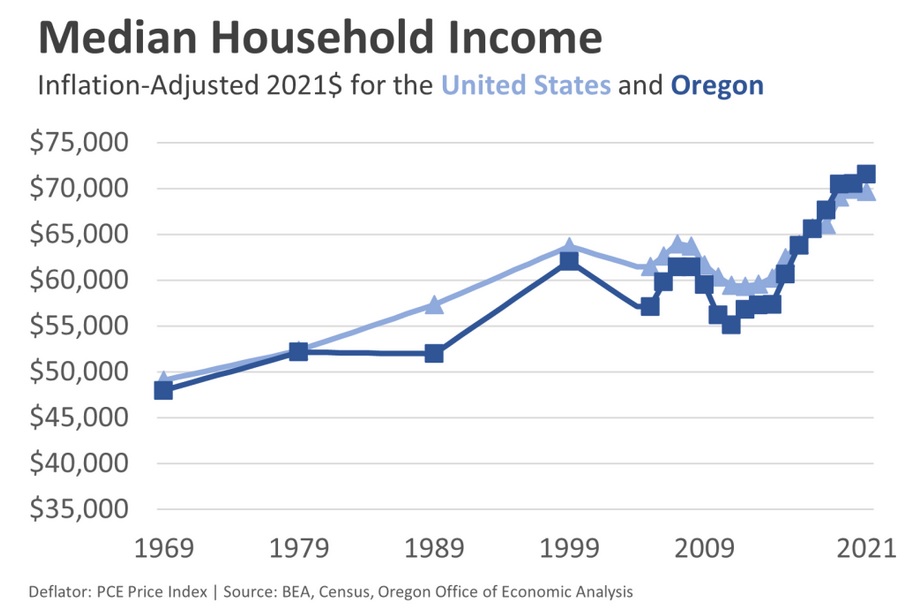
Median household incomes in Oregon reached a new all-time high last year, even after accounting for inflation. Oregon’s median household income grew 5.4 percent overall, and 1.4 percent after adjusting for inflation. U.S. median household income grew 3.9 percent, but declined 0.3 percent after adjusting for inflation. Oregon’s median income now stands 2.6 percent higher than the U.S. This is the largest relative vantage point for our typical household vis a vis the nation in at least three generations. Oregon income growth this past decade has been much stronger than in most parts of the country.
[5]
While middle-income households have fared well when you consider it’s been a global pandemic, a deep recession, and high inflation, we see some diverging trends at the top and bottom of the distribution. This next chart compares income growth by quintile in Oregon from 2019 to 2021. Census did not publish these figures for the 2020 experimental estimates, but getting a snapshot comparison of pre-pandemic to mid-pandemic can still be useful.
Here we see that the middle 60 percent of Oregon households have all seen their incomes rise faster than inflation. Most of us have been able to keep our heads above water financially, even if it doesn’t always feel that way. Our highest income neighbors have fared even better in recent years (and decades). Given that high-wage jobs were impacted the least during the recession, and asset markets boomed, at least through the end of 2021, this isn’t really a surprise.
 [6]
[6]
However what stands our here is that our lowest income neighbors have lost ground. This is where the impact of the recovery rebates would be the biggest, certainly in percentage terms. I will update as I learn more. But, looking at the published data, on average, incomes for the lowest 20 percent of Oregon households, those with incomes less than $30,000 per year, are 4 percent lower than before the pandemic, after accounting for inflation. The underlying causes here is something I will dig into further in the months ahead. Is this driven more by the fact that low-wage industries bore the brunt of the pandemic, but have now recovered quickly in late 2021 and so far in 2022, or by something like our fixed-income neighbors haven’t been able to keep pace with overall growth and inflation?
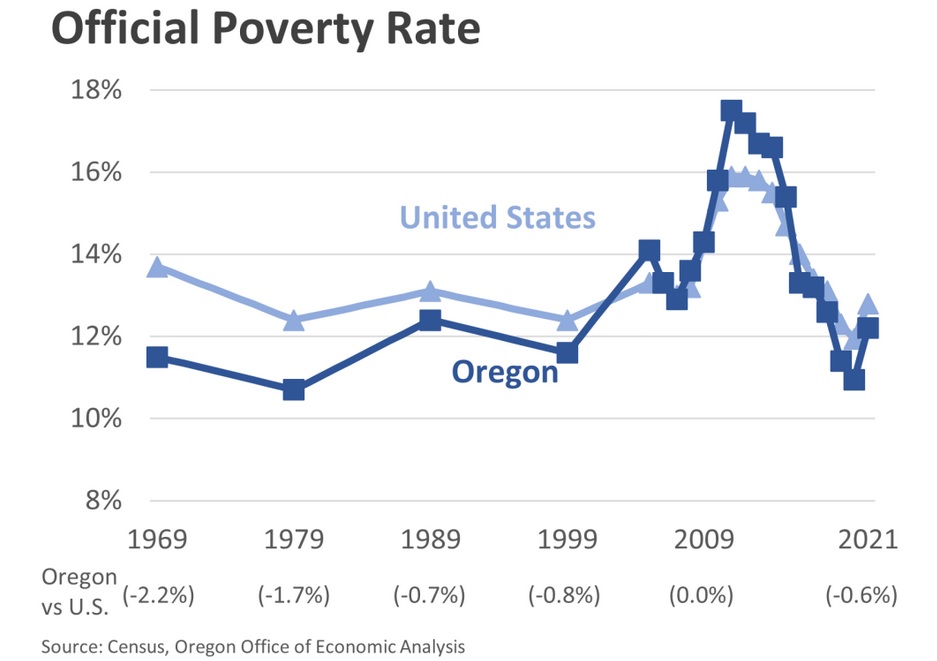
Regardless of the exact reason for the low-income declines, it does mean that poverty in 2021 increased. Oregon’s poverty rate rose to 12.2 percent, while the U.S. rose to 12.8 percent.
 [7]
[7]
Finally, the increase in poverty affected all Oregonians, as the racial poverty gap did not widen. This is in keeping with overall trends this cycle where a lot of long-standing disparities that typically widen during recessions, did not widen during the pandemic.
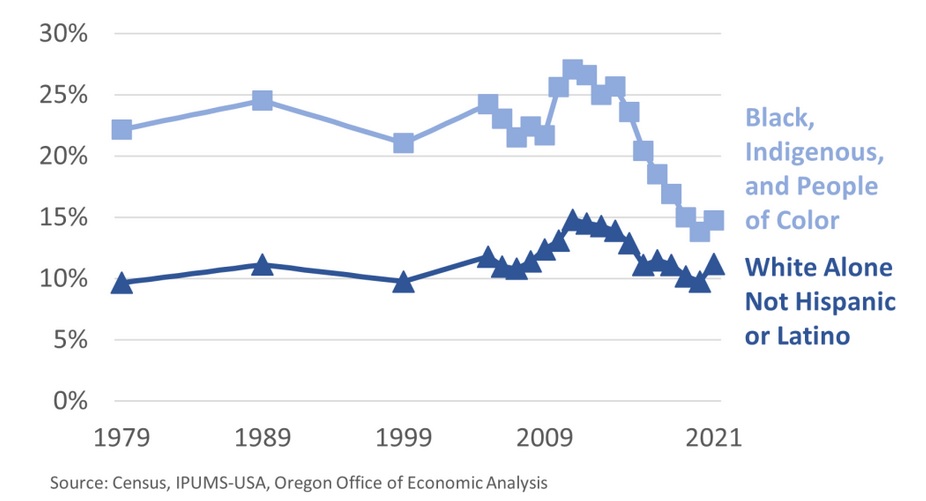
Now, poverty among Black, Indigenous, and People of Color remains higher than for their white, non-Hispanic neighbors, at 14.8 percent compared to 11.2 percent. However last year poverty increased 1.4 percent for white, non-Hispanic Oregonians, and 1.0 percent for BIPOC Oregonians. Technically this marks the smallest racial poverty gap on record, but is no real comfort when poverty increased.
 [8]
[8]
As I mentioned, I don’t have all the answers this morning as the data was just released. The impact of the recovery rebates, and other pandemic era aid like enhanced UI, the child tax credit and the like are important. In a separate data release earlier this week, Census found that the official poverty measure nationwide ticked up a little, but the so-called supplemental poverty measure declined considerably. The SPM looks at post-tax and transfer (public assistance) incomes, and is therefore a better gauge of poverty last year than looking at just pre-tax earnings. Some of those technical differences should be less of an issue in the ACS than in the household survey (CPS ASEC) but could still be an important factor. As we learn more and more data is released, we will continue to post updates and findings. Our office will also dig into the data included in the ACS like household formation, characteristics of migrants, working from home, and the like. Stay tuned for more in the weeks ahead.