 [5]
[5]
By Josh Lehner
Oregon office of Economic Analysis
Stories about pandemic migration and working from home abound, even as we are months away from any hard data. This can be a struggle, balancing these anecdotes and speculation when we lack any real evidence. And the issue isn’t that these things are not happening. They clearly are. The issue is that Oregon sees hundreds of thousands of people move every single year. What really matters is when any changes are widespread enough to be more than noise.
To that end, we just don’t know yet. We will get Oregon population estimates from Portland State in December, but need to wait until April for the full set of underlying data tables. And the 2020 ACS data won’t come out until September 2021.
The key question is to the extent we do see pandemic migration, will that be enough to offset the fact few people moved during the shelter in place phase of the cycle, let alone offset the traditional slowdown in migration during recessions? Statewide, our office does not believe so, but our forecast may be too pessimistic given this is not your normal business cycle. Plus regional patterns will always differ from statewide figures.
Our view is further clouded by the fact the DMV is appointment only these days due to social distancing. As such we have lost our traditional real-time migration indicator: surrendered driver licenses. That leaves us looking at things like home sales as a measure of mobility, even as it is hard to disentangle local moves vs out-of-state migration.
Here we see ongoing strength in housing due to the fact higher-income households have been less impacted by the recession to date, interest rates are at record lows, and there is the strong demographic tailwind of Millennials aging into their 30s and 40s.
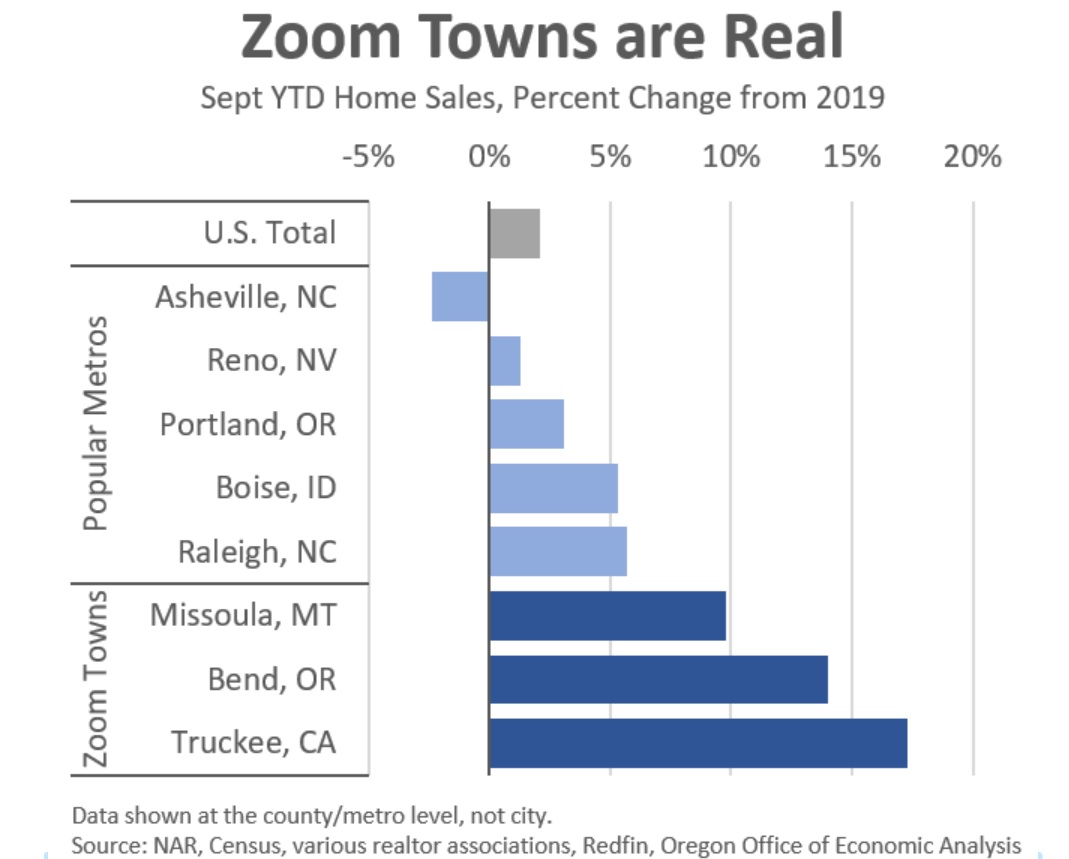
Even so, all of these factors bring home sales nationally and in some popular metro areas to a point where 2020 will show solid to very strong gains. But there are some places experiencing eye-catching growth. Home sales are up double digits among Conor Sen’s “Zoom Towns” [6] — popular, smaller, scenic areas from which workers can telecommute. Keep in mind that given the ongoing strong demand and pending sales numbers, the final year-end figures will be up even further across all locations.
UPDATE: The chart has been updated to reflect better Missoula home sales data. The previous chart showed 22% growth which was incorrect. The true number is 9.8% per local MLS statistics [7]. A big thank you to Brint Wahlberg, a Missoula realtor, for spotting the error and correcting the data. My apologies for the error.
 [8]
[8]One of the key questions earlier this year was whether we would see people double down on existing patterns of migration and places to live, or whether we would see new patterns emerge. Keep in mind that it is still early in the cycle and the winds may change as it drags on, but early returns indicate we are doubling down.
Now, I want to touch on a couple related issues. The first is inventory, which is down about 40 percent a lot of places in Oregon, and 20 percent nationally. Normally inventory does not actually restrain sales. The main reason inventory is low is because sales are strong! But this year in some places it may actually be an issue. Take Hood River for example. You can currently count on your fingers the number of homes for sale, even at luxury price points. This extremely lean inventory is problematic for the market. But more generally, lower inventories make it a sellers’ market, and prices appreciate faster.
Second, I think the major increases in luxury homes are distorting some of the overall market figures. Some media articles out of Montana indicate the $1 million+ properties are a hot segment. In Bend, sales have been very strong above $750,000 with pending sales of $1m+ through the roof [9]. Now, it’s hard to say that this means all that much for middle-income families, but it does drag up the average, and even the median home price due to a big compositional shift.
Third, it remains an open question as to what all these home sales actually mean for migration and population growth. Most buyers are usually local. They tend to be either first-time or move-up buyers. However a part of the strength is tied to migration as well. Increases of 10-15% in the Zoom Towns is not due to local demand alone. Although an added question is whether these sales represent true migration and population growth, or simply increased demand for second homes. That distinction may not matter for the housing market, but it does for the local economy.
Bottom Line: The housing market is among the strongest segments of the economy. Ownership is expected to remain strong due to demographics, low interest rates, and the nature of the cycle. Even so, popular, scenic areas have experienced an even greater influx of demand. Zoom Towns appear to be real and pandemic-related migration looks to be doubling down on existing patterns of growth.