 [5]
[5]
By Josh Lehner
Office of Economic Analysis
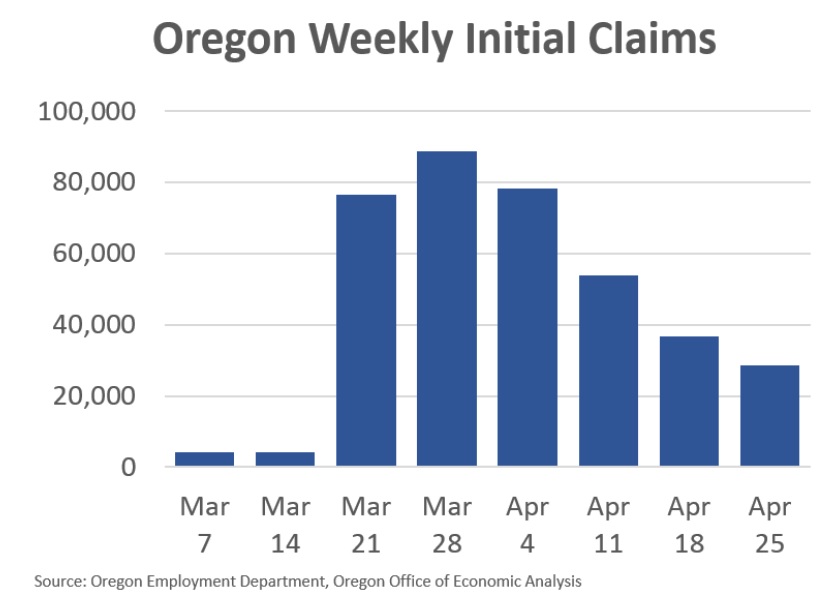
The Oregon Employment Department has been doing a good job every week publishing the latest data and providing insights into who is applying for unemployment insurance. As seen in the chart, the first wave of initial claims from the COVID-19 recession is thankfully dissipating. However the level of claims remains significantly high by historical standards and the cumulative totals are staggering. In the past 6 weeks, Oregon has seen nearly 340,000 more initial claims than would have been expected in a strong economy.
We’ve also been able to learn a great deal about who is filing these claims in terms of their age, industry, occupation, educational attainment, county and the like. As I’ll get to in a minute, this has been quite helpful in terms of helping our office think through this initial shock to the economy. But before we get to that I would recommend reading OED’s Damon Runberg’s, insightful look at these characteristics, or watch the tag team presentation Damon and I did last week. Additionally I just wanted to add another lens to look at the data: the ability to work from home.
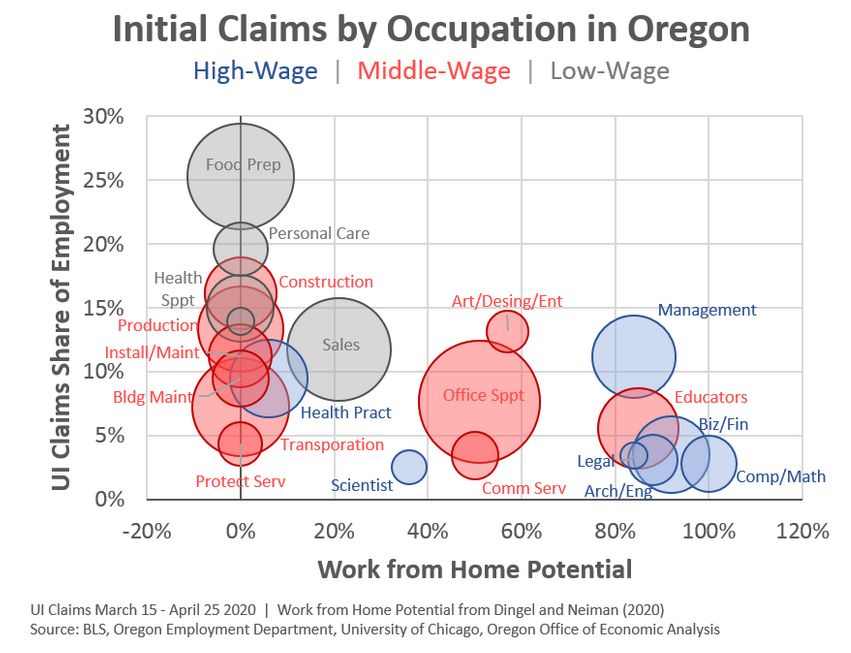
The next chart combines three things. First, the occupation of Oregonians filing initial claims (y-axis). Second, new research from economists out of the University of Chicago on the potential of working from home by occupation based upon the tasks they perform and how much interaction they need to have with clients or customers (x-axis). Third, job polarization research and the breakdown between low-, middle-, and high-wage occupations (color of bubbles).
As expected you see that lower wage occupation in food preparation and personal care lack the ability to work from home and have seen the largest share of the workforce file for claims. These jobs require performing duties at specific locations for customers coming through the door. Conversely, high-wage jobs can largely be done from home provided there is an internet connection and have seen the smallest share of such workers file initial claims. Middle-wage jobs are a mixed bag on both fronts. Overall the University of Chicago work indicates that about 1 in 3 workers in Oregon have the ability to work from home, at least theoretically. As seen in the Venn diagram yesterday, this 1 in 3 goes for both workers with or without kids.
 [6]
[6]
Finally, we know that our traditional economic data lags by a month and usually more. The first substantial impacts of social distancing on the labor market will show up in the April employment report. For Oregon that report will be released on May 19th, the day before our office’s forecast release on May 20th. In other words it comes too late this cycle to be of any real assistance. We are building the plane as we fly. The characteristics and nature of the initial claims have been quite helpful in clarifying our office’s thinking as we develop the outlook.
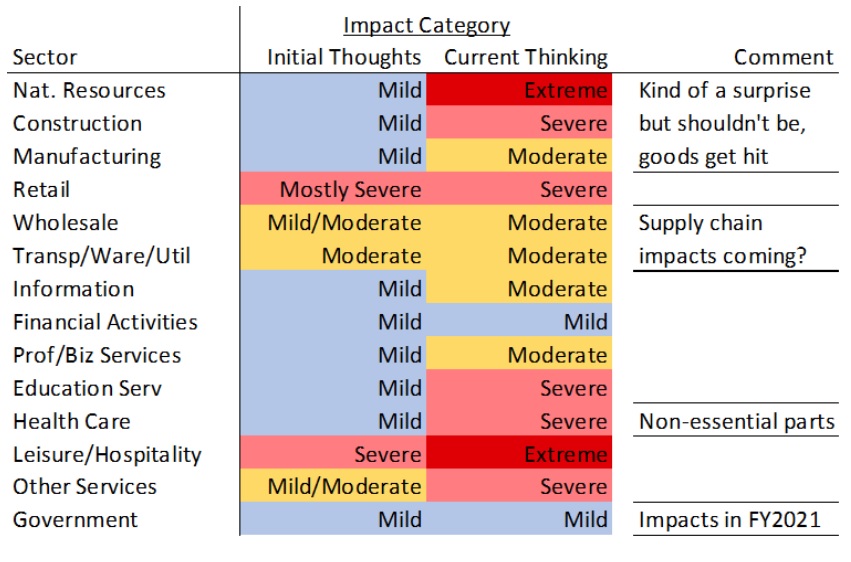
I won’t get into hard numbers today — that’s what our actual forecast is for — but I wanted to provide an update on the industry impacts of COVID-19 and our office’s thinking. The table shows the various sectors of the economy and how one may group them based on the severity of the recession. The first column is based on some of the initial thinking about the nature of social distancing a month or so ago. Retail plus leisure and hospitality would take the biggest hits, plus their transportation networks and supply chains. The second column is stepping back today, looking at the data so far and our beliefs about the trajectory of the cycle.
 [7]
[7]
A few things stand out. Even as these categories are graded on a scale and the importance is the relative distinction across sectors, the severity of the recession is worse than many forecasters expected even a few weeks ago. It seems like most national forecasters are still trying to catch up to the reality on the ground. Every update they provide to their outlook is a bit worse than the previous iteration. Time will tell just how severe this initial drop is, and how strong of a rebound we get from pent-up demand once the health situation improves further and social distancing policies begin to lift.
But what I want to focus is the simple fact that the impacts are not contained to just bars, restaurants, nail salons, and the like. Yes, that may have been the tip of the spear. However we are seeing the impacts bleed throughout the entire economy. No sector is left unscathed. This was our office’s biggest concern about the initial line of thinking that emerged. Even today you can still find newly released reports trying to gauge the number of workers at risk due to social distancing policies. We’re more than a month past that stage. That research is no longer helpful. The simple reason why is that the demand shock has been so large that it impacts everything.
Update: A few people have asked about the Government being classified as mild. This is certainly the case right now. Our office is building in declines in the coming fiscal year, some of which are persistent over the entire forecast horizon. It’s not that the public sector won’t be impacted, it’s a matter of degree. The overall recession is severe, but right now the outlook for public sector employment is a bit less than that.
In terms of the outlook, not every sector will follow the same path. Our office is still thinking along the lines of a square root recovery overall, but there are underlying differences. Oh by the way, Fed Chair Powell is thinking along the same lines as seen in his press conference this week (see his remarks at 24:00 in the video, or pg 12 of the transcript).
The rebound in economic activity in the months ahead will likely be concentrated among the consumer service sectors. This includes leisure and hospitality, retail, other services, plus other industries like health care as elective surgeries come back, financial activities as the real estate market picks back up some, and the like.
What likely won’t show the same patterns would be our goods producing industries, which have taken a hit. One reason is the demand shock is still being felt. It takes time for some chain reactions to occur. A loss of income today turns into reducing spending today, yes, but also in the months ahead. In particular, sales of big ticket durable goods — appliances, cars, homes, etc — are very volatile over the business cycle as firms and households can delay such purchases until their income or confidence returns. So even as consumer services will return to growth later this year, it may be reasonable to expect goods producing industries will see losses throughout 2020 before returning to growth a few quarters down the line. At least provided overall economic activity continues to pick up, propping up demand.
If we look further out to the mid- or late-2020s, what changes can we expect to see? That’s a bit harder to answer, obviously, or rather the forecasts have a lot larger error bands around them. We are likely to see some structural losses among our goods producers, retail and so forth. Some of these industries were already on edge and while turning off the lights on the economy is easy, restarting it is not as simple as flipping the switch back on. Furthermore, I am skeptical that we, as a society, will be going out to eat significantly less in 2025 than we were in 2019, provided the public health situation is under control. As such, it is quite possible that the sectors most impacted by social distancing will return to their old trajectories, or close to it, while it may be these other sectors that bear the brunt of the long-run permanent damage.
In terms of process, our office is nearing completion of the economic outlook and ramping up our focus on translating that into state revenues in the weeks ahead. Stay tuned for our latest thinking ahead of the forecast release on May 20th.