![]() [5]
[5]
By Josh Lehner
Oregon Office of Economic Analysis Blog [6]
In a recent report, Employment Department regional economist Damon Runberg takes a thorough look at Oregon’s destination resorts [7] and their impacts on jobs, wages, hours worked and taxes. Destination resort does have a specific definition and 6 of the state’s 9 official destination resorts are in Deschutes County with one each in Crook, Klamath and Lincoln counties. Overall the industry is stabilizing after suffering losses during the Great Recession, not unlike broader measures of tourism and consumer spending on recreational activities. Do read Damon’s article as it includes lots of good nuggets of information like destination resort employees work more than the other leisure and hospitality employment and 2/3rds of Deschutes’ lodging taxes come from the Sunriver area, to list just two.
Which brings us to another point in terms of the economy, outlook and consumer spending. It is good news that tourism has bounced back, particularly for some of the regional economies along the coast, Central Oregon and the Gorge. While we lack a sales tax which would allow us to better track consumer spending — both by industry and by region — we do have a number of resources available to help.
First, Dean Runyan Associates in conjunction with Travel Oregon has built a fantastic interactive website [8] tracking travel spending and impacts across the state. They also have a monthly Oregon Travel Barometer [9] that provides a quick snapshot of activity.
Second, one can check employment in the leisure and hospitality industry, specifically accommodation and food service [10], which has rebounded strongly so far in recovery. A lot of the growth is concentrated on the food service component (mainly bars and restaurants) but the accommodation part has also seen pretty good growth.
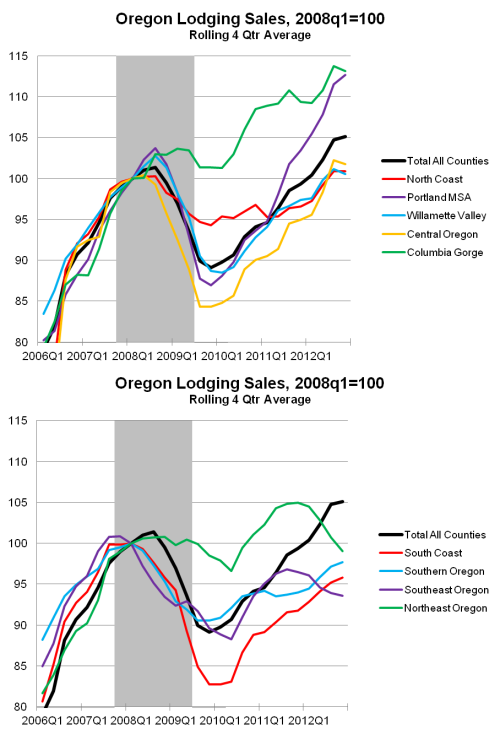
Finally, lodging tax receipt data is available from the Oregon Department of Revenue [11]. Right now data is only available through 2012, but the general patterns do not change much year to year. There are lots of good pieces of information in the report if you are interested, however I wanted to pull out just a few items. In terms of sales, the sheer volume of visitors — both recreational and business — to the Portland Metro dominate the statewide figures. However, when you convert the sales to a per capita figure, here is where the tourism hubs of the state standout. The North Coast clearly has the greatest comparative advantage when it comes to lodging relative to their local population. Followed by the South Coast, Central Oregon and the Gorge.
Lastly, the following takes a look at how lodging sales have fared by region over the business cycle. The top graph shows the regions that by the end of 2012 had regained their recessionary losses and the second graph illustrates the regions that had not yet returned to peak.
The 2013 data should be available in a few months and it will be important to keep an eye on that. The Department of Revenue has much more for those interested in terms of type of lodging (hotel, bnb, campground, etc) and by county (I just compiled them into our normal regions).

