![]()

Tax Comparisons: Sales vs. Income
By Josh Lehner
Oregon Office of Economic Analysis Blog.
- Over past 26 years (FY86 – FY12) Oregon’s personal income tax revenue has averaged 6.3% growth while Washington’s retail sales tax revenue has averaged 4.6%.
- However there is a clear risk-reward aspect to Oregon’s income tax as its volatility is over 40% larger than Washington’s sales tax over this period.
- How do you value stability vs return?
- Both tax instruments face longer run headwinds due to demography.
- Changing the type or mix of taxes also changes who pays the tax, so distributional equity should be considered.
There has been a significant movement in Oregon over the past few years toward having a discussion surrounding the state’s tax structure and even making changes to it. This has ranged from the actual passage of things like Measures 66 and 67 in 2010 and Measure 85 in 2012 to discussions between public officials and business groups on potential reforms and also, editorials from entities such as The Oregonian, making tax reform a major item on their 2013 agenda. Our office is not only in full support of having this conversation but encourage Oregonians to do so as bringing topics like this into a broader public discussion is very important and informative. With that being said, it is also important to have a full discussion around topics like this and not just a few bullet points. It should be pointed out that tax systems are also very complex and mufti-faceted with taxes and fees on a whole host of items and activity. However, when the discussion turns to the issue of tax revenue the story, at least in Oregon, is much more simple as the personal income tax dominates the state’s general fund (which is what our office is tasked with forecasting). The largest potential change that is usually discussed is the introduction of a sales tax in Oregon, with the specifics varying in size and scope. To this end, what follows is a comparison between Oregon’s personal income tax revenue and Washington’s sales tax revenue over the past 26 years (FY 1986 – FY 2012). Many thanks to our colleagues at the Washington Economic and Revenue Forecast Council for sharing their sales tax data and previously their sin tax data with me for these purposes.
For my money, here in the NW we have a great natural experiment between Oregon and Washington. The two states share many similar traits when it comes to their economies, populations, culture, geography, climate, etc. However one major difference is tax policy. Oregon is heavily reliant upon the personal income tax and has no sales tax while Washington is heavily reliant upon the sales tax and has no income tax. It should be noted that singling out two states in particular (no matter how similar in other respects) may not provide the most robust results when applying the findings to other regions or countries. For this reason your mileage on the Oregon-Washington comparison may vary. In fact, Professor Emerson over at the Oregon Economics Blog has numerous posts over the years on sales taxes, their implications and also highlights some academic studies that find the volatility may not be less for sales taxes compared to income taxes. While there are myriad factors that need to be controlled for when comparing even the same tax across jurisdictions, I do believe the following graphs and figures provides a useful comparison of the two main tax instruments.
Overall, in the average year personal income taxes have grown more quickly than sales taxes, however they are also more volatile from year to year. During the past 26 years, Oregon’s income taxes have averaged 6.3% growth but with a standard deviation of 7.6%. This means that, assuming a normal distribution, about 68% of all the values will fall within the average plus or minus the standard deviation. Washington’s sales taxes have averaged 4.6% with a standard deviation of 5.3%. The histograms below show the distribution of growth over time. Washington’s sales tax distribution is clearly more narrow with fewer years far away from the mean, with the vast majority of the years between 0-10% growth. Oregon’s distribution, on the other hand, is less narrow, with the central tendency being higher with the majority of the years between 5-15% growth. A key question to ask is how do you value risk versus return or stability in the underlying revenue source versus working to manage through the volatility? The answers to these questions are subjective and not objective. Each individual will place different values to these outcomes and it will be up to the legislative process to determine the end result, should major tax reform occur.

You can see this distributional effect, or volatility, a little more clearly in the following box plot. Reminder: the end points of a box plot represent the minimum and maximum values, the bottom of the colored box is the 25th percentile, the middle line in the box is the median value, the top of the colored box is the 75th percentile. That is, the colored boxes represent the range in which half of the values fall between, or the middle 50%. The extreme years are not too dissimilar between Oregon and Washington, however the middle 50% clearly shows the distributional discrepancy. Half of Washington’s growth falls within 2.4-6.7% while half of Oregon’s growth falls within 3-11.5%. For those curious minds, the top year was 1990 when Washington’s sales taxes grew 17 percent and Oregon income taxes grew 16 percent. The worst year for both states, as you probably expected, was 2009 when sales tax collections plunged nearly 11% and income tax collections dropped over 15%.

While the above discusses the risk and return of these tax types in recent decades, a key question is what will be their effectiveness moving forward both in terms of raising revenue to provide goods and services for citizens and also on economic growth. The next graph illustrates the revenue gained from these taxes as a share of personal income. While Oregon’s share has fluctuated with the business cycle, it has also been on a slight downward trend over the past decade. (The strong economic and income growth in the 1990s in Oregon resulted in an upward trend.) Washington’s sales taxes as a share of income has been on a downward trend for nearly two decades at this point. These trends indicate that both income taxes, to a lesser degree, and sales taxes, to a larger degree, are losing some of their effectiveness at generating revenue. Depending upon your view of the public sector you may see this as good news, however to the degree that all citizens benefit from some of the goods and services provided by the public sector, this will present fiscal challenges moving forward.
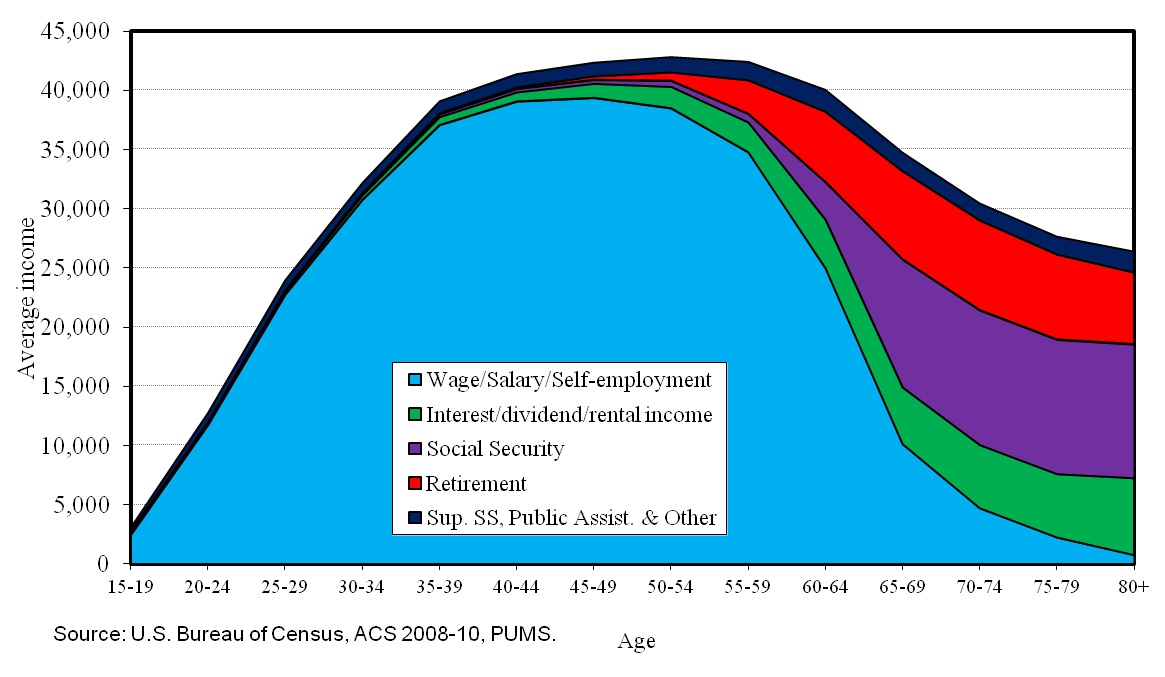
The key reason for this decline is largely demographic and due to the aging Baby Boomers. The following graph illustrates income in Oregon, and its composition, by age group. During individuals’ peak earning years, on average, they earn about $40,000, nearly all of which is taxable in Oregon. As an individual ages into retirement their income not only declines but the composition of income changes substantially, having an even larger impact of tax revenue. For individuals in their 70s, overall income has declined from that $40,000 during their peak earning years to around $30,000, however their taxable income is closer to $20,000 as Oregon does not tax social security. This difference has big implications for future income revenue in the state. A similar story can be told for sales taxes, as well. During people’s peak earning years they are buying cars, washing machines, furniture, in addition to the basics such as food and clothing, however as one ages, the composition of items purchased changes. Older individual spend a larger portion of their income on items that are generally not taxed such as food, housing and medical care.
Both our office’s forecast for personal income taxes and Washington’s outlook for sales taxes clearly take into account these trends moving forward. Growth across the board is expected to be slower as the Baby Boomers retire, their incomes fall and their spending patterns shift. There may be some debate as to which tax will be more effective moving forward with the aging demographics: does taxable income fall more quickly than spending on taxable goods, at least as a share of income, or vice versus? While it appears our office’s outlook is nearly twice that of Washington’s that is largely a function of using 10 year averages. The majority of the gap between the blue and red lines is due to the strong income tax growth Oregon has seen since the depths of the recession (particularly FY11 with nearly 12% growth). Over just the next 5 years, Washington is forecasting sales tax growth of 5.0% on average while we are projecting income tax growth of 5.6% on average.

Finally, when tax policy changes, the tax burden and who pays it also changes. The graph below, reproduced based on data from the Institute on Taxation and Economic Policy, illustrates the share of a family’s income going to state and local taxes by income group, from the poorest 20% to the top 1% of the income distribution. Their report has detailed data for all states, for those interested in further comparisons. Overall, state and local taxes tend to be somewhat regressive as seen in the All States values (blue bars). The largest reason for this is that sales taxes in general are regressive and most states have a sales tax. These taxes are only applied to spending on taxable goods; seeing as lower income families spend a larger fraction of their income (saving less), they pay taxes on a larger fraction of their income than their higher income counterparts who typically save more.

Oregon and Washington are somewhat of extreme examples as neither has both a sales and income tax, like the majority of states. According to the ITEP report, Washington’s tax system is the most regressive in the nation and the effect is seen in the graph above where lower income families pay a much larger share of their income in taxes than do higher income families. UPDATE: In the comments, Fred Thompson notes that while ITEP is the best source for state and local tax incidence it does overstate resistivity due to the way they allocate property taxes, include the federal offset and not incorporate business taxes to business owners, who tend to be higher income individuals. Fred finds that Oregon’s tax system is progressive after accounting for the items he highlights. I agree with his assessments and have withdrawn the following sentences. However the main theme I wanted to highlight with this portion of the post is that sales taxes in general are regressive and income taxes can be progressive (although not all of them are in practice) and that does not change. From time to time Oregon’s tax system is described as one of the most progressive in the country, however that is really only half true. Oregon’s tax burden across the income distribution is really more of a flat tax, although prior to Measure 66 which this data is, it was still slightly regressive as seen in the red bars above. Measure 66′s impact on these calculations will make it even more of flat tax, in terms of the tax burden. The reason Oregon’s system gets called progressive is because ranking all states against each other, where the vast majority of the states are regressive, Oregon is near the top of the list even if the actual tax burden is not necessarily progressive in and of itself.
It is certainly worth keeping in mind that introducing a sales tax in Oregon and lowering the personal income tax, in a hypothetical example, will alter these tax burdens across the income distribution. This is the case even if the overall package is designed to be revenue neutral. While our office makes no recommendations on which tax burden distribution is the right one, that will be determined in the legislative process if they so choose, it is important to have the discussion and realize the implications of any changes.


Disclaimer: Articles featured on Oregon Report are the creation, responsibility and opinion of the authoring individual or organization which is featured at the top of every article.