by Jessica Nelson
Oregon Employment Department [5]
The number of working poor in the United States increased slightly between 2006 and 2007. The working poor are individuals who were in the labor force [6] for at least 27 weeks during the year, but still had incomes below the official poverty level [7]. About 7.5 million people fit that definition in 2007, up from 7.4 million in 2006. The working poor accounted for 5.1 percent of all people who were in the labor force 27 weeks or more in 2007.
These figures come from the Bureau of Labor Statistics’ (BLS [8]) annual Profile of the Working Poor.
Those who were usually employed part time were more likely to be among the working poor. The working poor rate was 3.6 percent for those workers who were usually employed full time, while it was 11.9 percent for those usually employed part time.
Younger people were more likely to be poor. The working poor rate by age group peaks at 10.6 percent for those ages 20 to 24, and then declines with each successive age group.
Nationally, more women were considered working poor than men in 2007, at 3.9 million and 3.6 million respectively. In addition, women who head families were more than twice as likely to be among the working poor as men who head families.
Workers with higher levels of education are less likely to be among the working poor. Very few college graduates who were in the labor force for 27 weeks or more in 2007 were among the working poor (1.3%), while 16.5 percent of those with less than a high school diploma fit this description.
A Higher Share of Part-Time Workers Are Poor
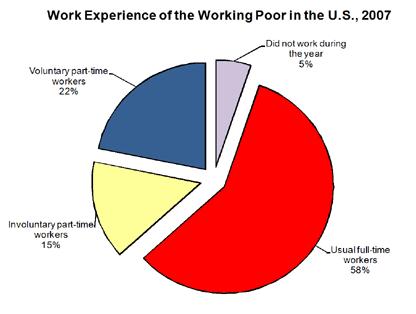
More than half (58%) of those characterized as working poor in 2007 were usual full-time workers (Graph 1). More than one-third were usual part-time workers. Many of these workers were voluntarily working part time. However, of all working poor people in 2007, 15 percent were involuntarily working part time and would have rather had full-time work. As the recession took hold, the number involuntarily working part time probably increased in 2008 and 2009, though these figures are not yet available.
While a majority of the working poor were usual full-time workers, these workers only accounted for 3.6 percent of all workers who usually work full time. In contrast, 11.9 percent of usual part-time workers fit the description of the working poor. For voluntary part-time workers, the working poor rate is 8.9 percent, but the rate skyrockets for involuntary part-time workers, where the working poor account for nearly one-quarter (23.8%) of all involuntary part-time workers.
Being in the labor force the entire year means lower working poor rates for most groups. In total, the working poor rate for those in the labor force 50 to 52 weeks is 4.6 percent, compared to 5.1 percent for those in the labor force at least 27 weeks. The only group with a higher working poor rate for those in the labor force all year is people involuntarily working part time – for that group those in the labor force 50 to 52 weeks had a working poor rate of 24.1 percent, slightly above the 23.8 percent rate for those in the labor force 27 weeks or more.
Young and Women More Likely to Be Poor
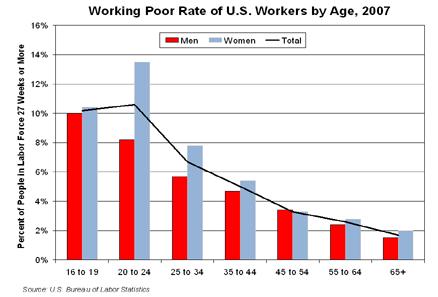
People ages 20 to 24 have the highest working poor rate, at 10.6 percent, slightly above the 10.2 percent rate for those ages 16 to 19. Starting with the 25 to 34 age group, the working poor rate goes down with each age group (Graph 2).
Women are more likely to be among the working poor than men. Overall, women’s rate was 5.8 percent in 2007, while men’s rate was 4.6 percent. For those 45 to 54 years of age, however, women’s working poor rate is one-tenth of a percentage point below that of men; women’s rate is higher than men’s in every other age group.
Men have a perfect inverse relationship between age and the working poor rate. Men ages 16 to 19 have the highest rate, at 10.0 percent, and then the rate drops with each successive age group. Among women, however, the highest working poor rate is for those 20 to 24 years of age, at 13.5 percent – above the 10.4 percent rate for women ages 16 to 19.
Family Structure Plays a Role
For families, the presence of children under 18 has a large impact on the likelihood of being among the working poor. Families with children under 18 had a working poor rate of 10.0 percent in 2007, compared with 2.0 percent for families without children.
Married-couple families are the least likely of all family types to be among the working poor, with a rate of 3.5 percent overall. Those with children under 18 years have a higher rate, 5.5 percent, than those without children present (1.3%).
Families maintained by women have a much higher rate than average – 18.2 percent were among the working poor in 2007. The rate surges to more than one-quarter (24.7%) for these families when children under 18 are present. Without children, families maintained by women have an average working poor rate (5.1%).
While families maintained by men have a higher rate than married-couple families, it doesn’t come close to the rate for families maintained by women. Overall, 8.5 percent of families maintained by men were among the working poor in 2007. Just like with other groups, rates are higher for families with children under 18; 11.6 percent of these families were among the working poor, while just 4.9 percent of those without children fell into that category.
Education Reduces Likelihood of Being Poor
It is often said – and with good reason – that education pays. People without a high school diploma are much more likely than other groups to be among the working poor (Graph 3). The working poor accounted for 16.5 percent of people without a high school diploma who were in the labor force at least 27 weeks in 2007. High school graduates, on the other hand, had a working poor rate of 6.3 percent. The rate for those with some college but no degree was 4.7 percent. People with associate degrees had a working poor rate of 2.8 percent. Of those workers with bachelor’s or higher degrees, only 1.3 percent were among the working poor.
Men have lower working poor rates at almost all levels of education. The one exception is among those who completed less than one year of high school (not shown separately in Graph 3), where men had a working poor rate of 18.8 percent, while women with the same level of education had a rate of 17.4 percent.
The gender difference is least apparent among those with a bachelor’s or higher degree. These women had a working poor rate of 1.4 percent, very similar to men’s 1.2 percent. Working poor rates of those with associate degrees are also fairly similar, with women’s rate at 3.2 percent and men’s rate at 2.4 percent.
The Great Unknown
How the current recession will affect the working poor remains to be seen. Many in the media have noted that this recession is disproportionately affecting the employment of men. Many industries with high proportions of male workers have dropped jobs at alarming rates, while industries with high concentrations of women, especially educational and health services, have not been affected as severely. We may see more men among the working poor as new statistics for 2008 and 2009 become available. However, there’s also the possibility that many formerly non-working spouses of the unemployed will be on the hunt for jobs, themselves joining the ranks of the unemployed, and possibly the working poor as well.
It is also likely that the number involuntarily working part time will surge in 2008 and 2009, as full-time work becomes scarcer.


