 [5]Oregon Wages, A 2017 Update
Oregon Office of Economic Analysis [6]
by Josh Lehner
The labor market is tight, the share of prime working-age Oregonians with a job is back to mid-2000s rates across all levels of educational attainment. While this is certainly good news, the question our office is being asked more and more is about wage growth. We have a lot of jobs, but what about wages? What follows are a few of the standard charts our office uses to think about wages in Oregon.
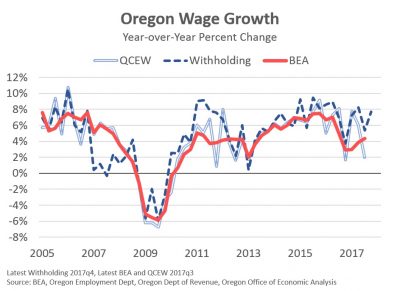
This first chart looks at total wage growth across the state. These measures are a combination of employment, hours worked, and hourly wages. It measures wages, and other wage-related items like bonuses in aggregate, or in total across all individuals working in Oregon. In particular, the dark blue withholding line is what our office really cares about given it is a primary source of state revenues, and what our office forecasts. Over time these measures of wages tend to move together, as you would expect, even as there are brief periods where the series do diverge some. For example, the differences seen in 2007 and 2011 were due to withholding table changes, and not due to economic changes.
All told, total wages in Oregon have been increasing at a relatively strong rate in recent years. However, there has been a slowing in the past 18 months, just like there has been in employment growth. The economy is transitioning down from peak growth rates to something more sustainable over the long-term. Now, a key issue our office is facing is the fact that wages as measured by the BEA have slowed more than withholdings. This difference is something we have been discussing with our advisors in recent quarters. Withholdings tend to outpace other wage measures because they include stock options, and some other items as well. It’s mostly wages, but less a pure measure than the others. But this divergence is something we’re keeping an eye on. For now we are expecting wages to continue to see healthy increases, albeit at a slower pace than a couple years ago.
 [7]
[7]
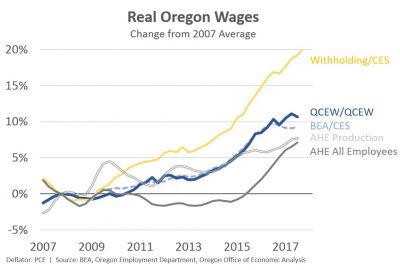
There is no one wage measure to rule them all, both at the national or state level. There are a number of available data sources, however each has its pros and cons. As such, our office tends to look at all of them to gauge overall trends. Below you can see how each of the most commonly used wage measures in Oregon has evolved in the past decade. Importantly, across all measures we have seen gains. The improvements are even seen in Average Hourly Earnings (AHE) for All Employees, which is a relatively new measure at the state level. It showed no improvements since its inception a decade ago until just a couple years ago. Since then it has gone all hockey stick on us, and is now approaching the gains seen across the other wage measures.
 [8]
[8]
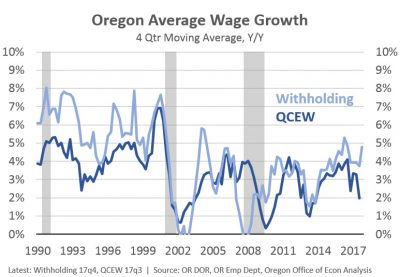
The third chart looks at the past couple of decades of average wage growth across two of these different measures. These local measures of wages are very noisy, hence why our office looks at all the measures to help gauge trends. However here too you can see we have seen wage gains in Oregon, and wage gains that have been on par with last decade, but below the 1990s gains. It is also important to point out that wage gains are seen across all industries and across all regions of the state. These gains cannot be tied directly to one particular sector or one particular regional economy.
 [9]
[9]
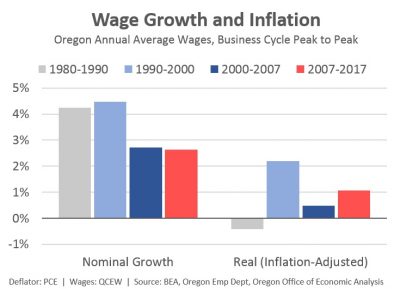
I think it is important to take a step back and look at wage growth across different business cycles. In the 1980s, paychecks in Oregon were increasing by about 4% per year, however inflation was a bit faster than this. As such, real, or inflation-adjusted wages in Oregon (and the U.S.) were actually declining. In the 1990s, wage growth was nearly 4.5% annually in Oregon, while inflation was in the 2-2.5% range. As such, real paychecks in Oregon increased by a bit more than 2% annually. During the mid-2000s, and again in today’s expansion, average wages in Oregon are increasing by about 2.5% per year. The difference has been that inflation is lower in recent years than a decade ago. That means, inflation-adjusted wages this cycle have actually increased faster than in the past cycle.
[5]
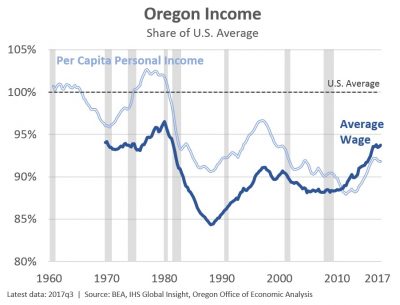
Finally, even as wage growth in Oregon has been nominally slower than in the 1980s and 1990s, and just a bit better on an inflation-adjusted basis relative to the mid-2000s, Oregon’s gains have outpaced the nation. I know this is a damning with faint praise point to make, however it is true. Oregon’s average wage, while still lower than the U.S. overall, is at its highest relative point today since the mills closed in the 1980s. Furthermore, Oregon’s per capita personal income, while still lower than the U.S. overall, is at its highest relative point today since the dotcom crash.
 [10]
[10]
This expansion in Oregon has been better than in much of the country, even if it has been lackluster for a lot of that time. The good news is that the economy is finally getting to where the feel-good nature of the business cycle is here. We are approaching full employment. Wages and household incomes are rising, while poverty and caseloads for needs-based programs are falling. Expectations are for these trends to continue until the next recession comes.