Oregon Economic Recovery Scorecard: Summer 2017
By Josh Lehner
Oregon Office of Economic Analysis
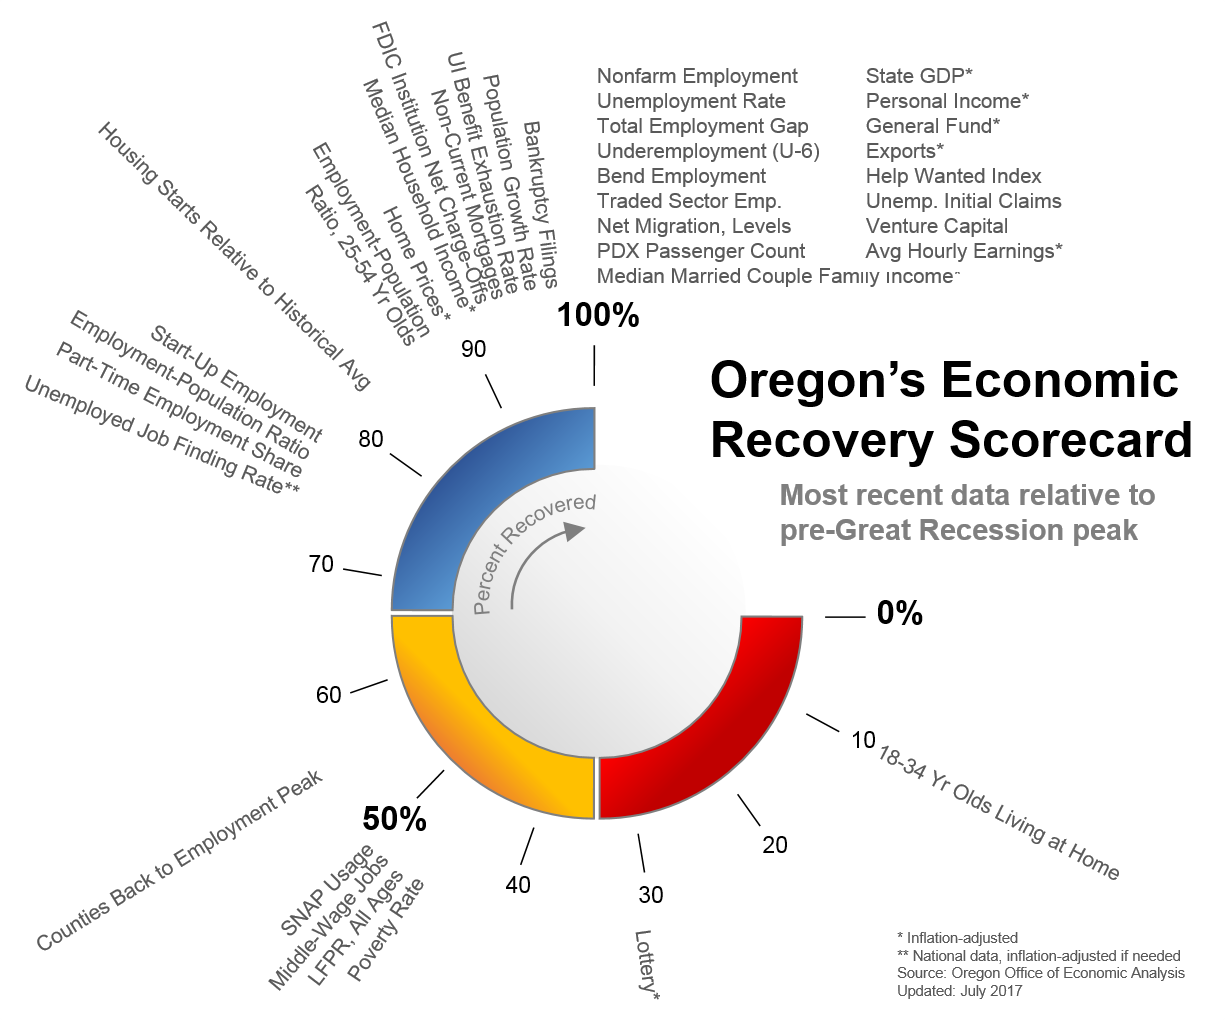
Top level economic measures never tell the whole story. Knowing how many jobs have been added is important but it alone cannot tell you if job growth is enough to keep pace with population growth, or about the types of jobs being added and so forth. That is why a few years ago we introduced the Economic Recovery Scorecard which showed the progress made across nearly 40 different measures. At the time a handful of the topline indicators like employment, state GDP and the like had returned to pre-Great Recession readings, however the vast majority of measures had not. In particular we knew that deeper measures of economic well-being had shown some, but not much progress.
Today it is clear very few measures haven’t shown considerable improvement in recent years. Nearly half of all of the included economic measures are back to their pre-Great Recession readings. Nearly two-thirds are 90% of the way back or better. And 4 out of 5 indicators are at least three-fourths of the way back. Again, clear progress has and is being made across the whole spectrum of economic measures.
Things I’m watching closely to mark further economic progress include prime-age EPOP and the stickier metrics like the poverty rate and caseloads for needs-based programs. As our office has discussed quite a bit in recent years, these are the last things to turn around. How much further progress we make at this point really depends upon how much longer the expansion lasts. To date the poverty rate and SNAP usage rate (share of Oregonians receiving SNAP) are essentially halfway back to where they were in 2007. And 2007 rates never got back down to the late 1990s rates either. There remains considerable room for further improvement in these types of economic indicators and our office thinks we will see some as the expansion continues.
In summary the Oregon economy really is doing considerably better than a couple years ago, let alone relative to the depths of the financial crisis. It is important to keep in mind that there are always problems and issues in the economy. This is true today and it was also true, say, back in the 1990s as well. For example, poverty rates were rising in the Timber Belt back then, even as the rest of the region and much of the nation were experiencing an economic boom. During expansions it is usually that the good news outweighs the bad and vice versus during recessions. Today the good news continues to outweigh the bad news, which is, well, good news.
Note 1: Stay tuned, I will have a bit more on SNAP usage and the business cycle later this week.
Note 2: The one measure shown previously but omitted from this version is median household net worth. The reason is that data, from the Federal Reserve, is only published once every 3 years. The most recent data is from 2013, which is really out of date today. 2016 data will likely be released in the next couple of months, but is not currently available. Once it is released, we will have a summary of the findings.


Disclaimer: Articles featured on Oregon Report are the creation, responsibility and opinion of the authoring individual or organization which is featured at the top of every article.