 [5]
[5]
Poverty and Progress, SNAP Edition
By Josh Lehner
Oregon Office of Economic Analysis [6]
As our office has been highlighting in recent years, Oregon’s economy is now at the point where we are seeing progress made in some of our deeper measures of economic well-being. Nearly all of Oregon’s economic metrics are back, or nearly back to pre-Great Recession readings. However, stickier measures like median household income, the poverty rate, and caseloads for needs-based programs are among the last things to turn around. Regarding the last one, some of the increases in caseloads are for structural reasons like demographics or even expanded eligibility, however there is usually some element of the business cycle involved, at least in terms of the larger, or better known programs like Medicaid and Supplemental Nutrition Assistance Program (SNAP, formerly called Food Stamps). Previously in the Poverty and Progress series our office looked at SNAP usage vs poverty rates, the Portland Metro area, Oregon overall, and Josephine County.
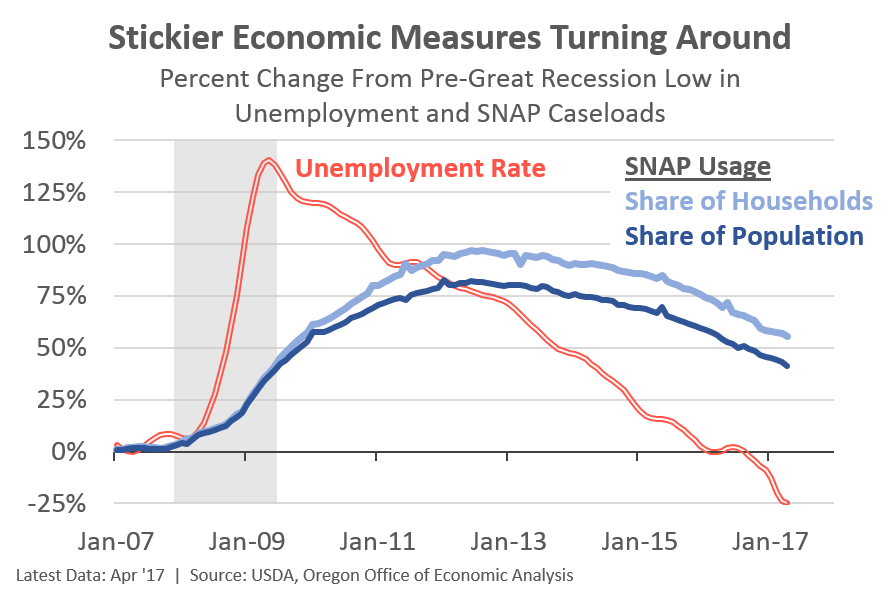
This edition of the Graph of the Week highlights changes in the SNAP caseloads in Oregon and the relative timing of these changes with the unemployment rate, one measure of the economy. What really jumps out is how quickly the job market can change, while needs-based caseloads are usually slower to adjust. While most unemployed workers apply for unemployment insurance benefits, the timing of other programs suggest they may not apply for these other programs immediately. Applying for, and receiving benefits like SNAP may occur after a spell of unemployment and as household savings are spent. At least that is one interpretation of the data.
 [7]
[7]
Today, even as the number of jobs has been at an all-time high for a couple of years now and the unemployment rate is lower than a decade ago, SNAP usage is about halfway back to pre-Great Recession rates. About 23% of Oregon households, or 16% of all Oregonians receive SNAP benefits so far in 2017, compared with about 15% and 12% back in 2007. The turning point in terms of these caseloads looks to be 2013 or so. While Oregon began adding jobs in early 2010, it wasn’t until 2013 that job growth really started to pick up some. At that time the Portland region’s growth accelerated from around 2% to 3% at an annual pace. More importantly the state’s secondary metros began adding jobs again, after a few years of no growth following the technical end of the recession. As these secondary metros started to surge in 2014 and 2015, plus rural Oregon adding jobs in greater numbers in 2015, SNAP usage began its downward trajectory.
Between now and the next recession our office expects to continue to see progress made on these stickier measures of economic well-being. We are fully in the feel-good part of the business cycle where household incomes are rising and poverty is falling. Oregon is not back to mid-2000s rates yet, but the trajectory and trends have improved considerably. However, mid-2000s should not be the goal, given economic conditions were better still in 1999/2000, the last time the economy truly was at full employment.
In terms of the outlook for SNAP itself, please see our friends over in the Department of Human Services, Office of Forecasting, Research and Analysis. As they report, there is a clear distinction between trends in SNAP – Self Sufficiency and SNAP – Aging and People with Disabilities. The former is expected to return to caseloads lower than before the Great Recession while the latter is expected to continue to increase in the coming years. These types of distinctions have a huge impact on the outlook, as our friends over in DHS like to remind us. It’s clearly not all about the business cycle, and in some programs it’s not influenced by the business cycle at all. You can find their latest statewide forecast document here, and the latest regional/district forecast here.
Note: I am using what I call the SNAP usage rate which is simply the share of all Oregon households or the share of Oregonians receiving SNAP benefits. The chart shows the percent change relative to pre-Great Recession lows. The unemployment rate itself went from 5% in the summer of 2007 to 11.9% in May 2009 (an increase of 138%). SNAP usage for households nearly doubled going from 15% to 29%, while SNAP usage for individuals went from 12% to 21%.