
Oregon Household Debt: Mostly Tame
Oregon Office of Economic Analysis
by Josh Lehner
In early 2017, total household debt in the U.S. reached an all-time high according to the Federal Reserve Bank of New York’s Household Debt and Credit Report. There has been some handwringing over this given huge debt loads last decade were one reason for the financial crisis and its severity. However one cannot just look at the total debt number without context. One must look at both debt and income, or liabilities and assets to make sense of the situation. What follows is an update on household debt here in Oregon.
First, while total outstanding debt in Oregon is also at historic highs in dollar terms, as a share of personal income it remains relatively tame. In fact, Oregon households are now leveraged the least they have been since the late 1990s and early 2000s. Now, it can be hard to say what the proper, or right amount of debt is. The key is using it property when needed and ensuring the ability to pay it off eventually. The good news is that national data continues to show servicing these debts takes a historically small share of our personal income. In other words, overall debt loads are in-line with incomes and we can make the payments.
Now, keep in mind that these are aggregate statistics. They add up all the debt or all the income in the Oregon economy. Individual households can obviously vary considerably and there are no doubt numerous households with too much debt and/or not enough income to pay for it.
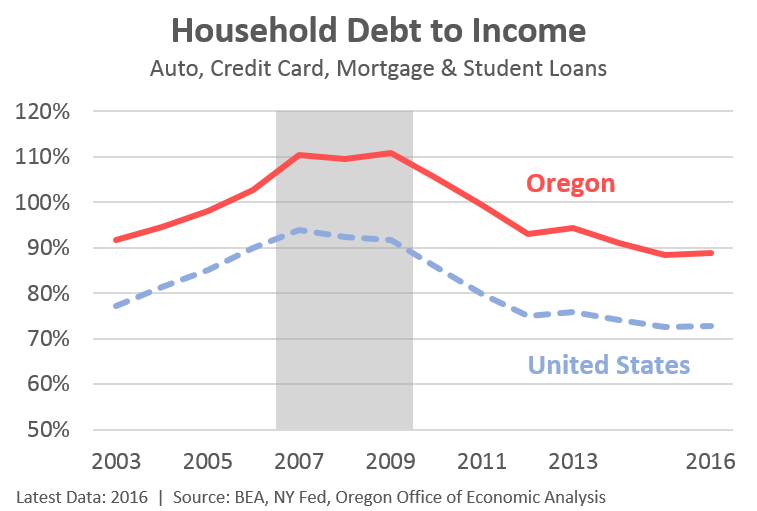
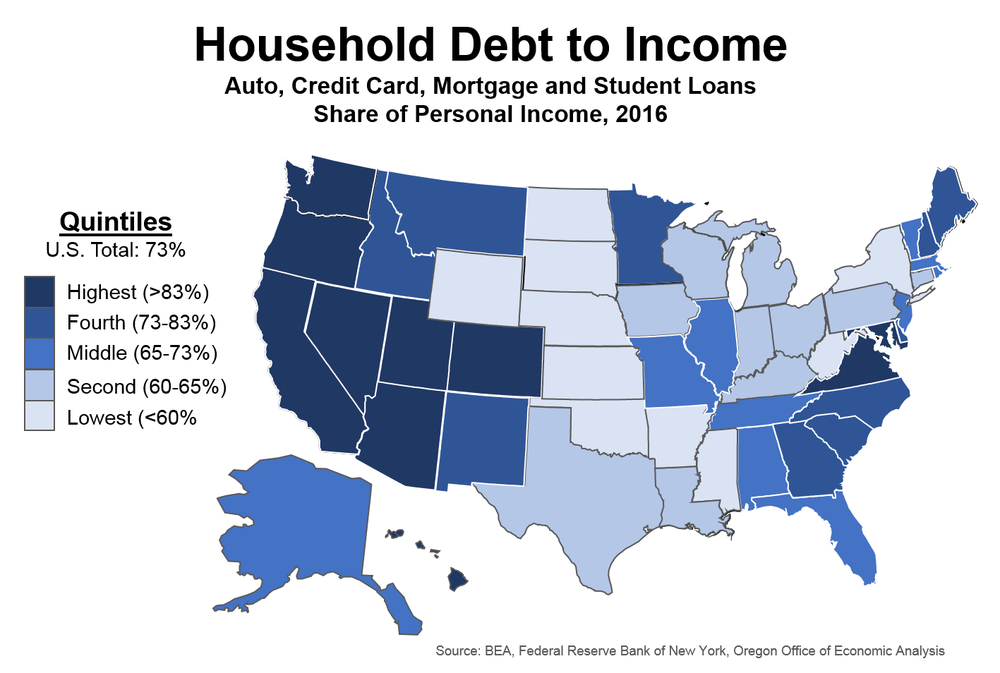
Even as Oregon’s relative patterns mirror the nation, our levels of household debt are larger than those seen in the typical state. This is true for our western neighbors as well. Specifically, California ranks 6th highest in terms of household debt to income, Oregon ranks 7th, Washington ranks 9th, and Idaho ranks 13th.
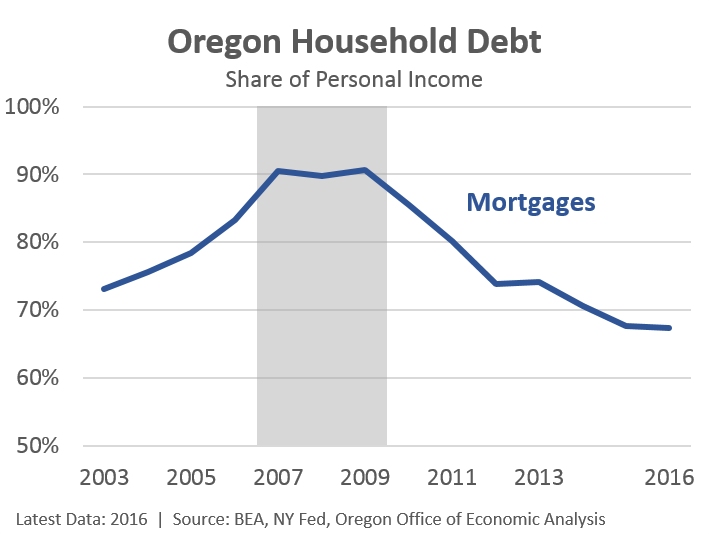
The primary reason for these patterns are housing costs as mortgage debt is the largest component of total household debt. With higher home prices along the Left Coast, it takes larger mortgages to buy a home. However, even here we are seeing relatively tame levels of mortgage debt, at least when compared with income. Yes, home prices continue to go up, up, up but we are now seeing corresponding increases in household incomes. Furthermore there has been strong growth in the number of higher-income households as the economy continues to improve, although such gains are not due to rich migrants.
It must be noted that some of the mortgage deleveraging following the crash was for a bad reason: foreclosures. When one loses her home, she also loses the debt. That said, even in recent years Oregonians haven’t been leveraging back up on mortgage debt. Thankfully, that (likely) means any potential housing issues in the future won’t have the same economy-wide fallout as last time.
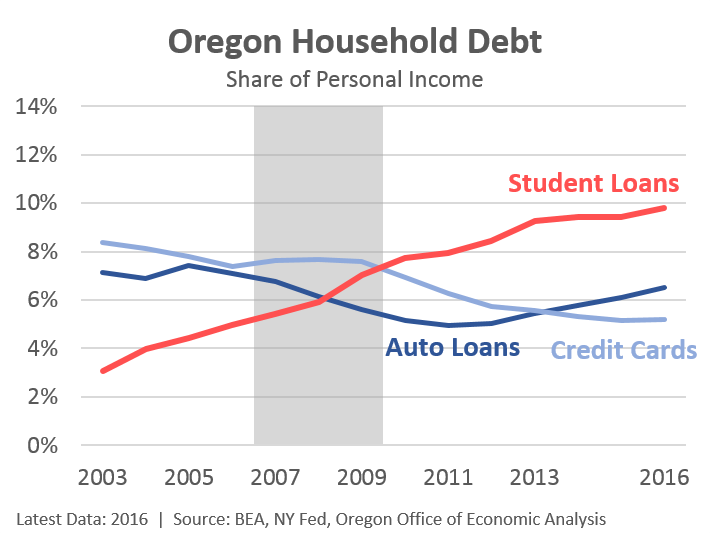
The next chart looks at other types of households debts beyond mortgages. Local trends, again, follow the same patterns seen across the country. That said, Oregon’s auto loan and credit card debts are lower than the national average or those seen in the typical state. Combined, Oregon ranks 31st highest among all states for auto and credit card debts.
There has been some discussion about subprime auto loans and potential issues there. The NY Fed had an article on that late last year. The bottom line, as Deutsche Bank economist Torsten Slok said, these loans may be a worry for those holding the debt, but it is not a problem for the macro economy. One reason is outstanding subprime auto loans are considerably smaller than the subprime mortgage market last decade, and the financial system has less leverage today as well.
Finally, student loans are one type of household debt that continues to grow. Oregon has a larger share of student loans than the typical state, however this is likely due to our migration trends. Oregon is a top destination for young college graduates.
As our office detailed a few years ago, the biggest issue with student loans is not the college graduates with six figure debts. Now, those are problems, don’t get me wrong. However such individuals do tend to get good-paying jobs and are able to service the debt. Default rates are actually lower for those with large loans.
No, the biggest student loan issues are those who do not graduate or who graduate from a program that does not actually provide skills valued by employers. Such individuals generally have relatively low levels of debt, ranging from a couple thousand dollars up to maybe $10,000 or $20,000. The issue is such individuals are not able to land a job that can allow them to pay off these loans.
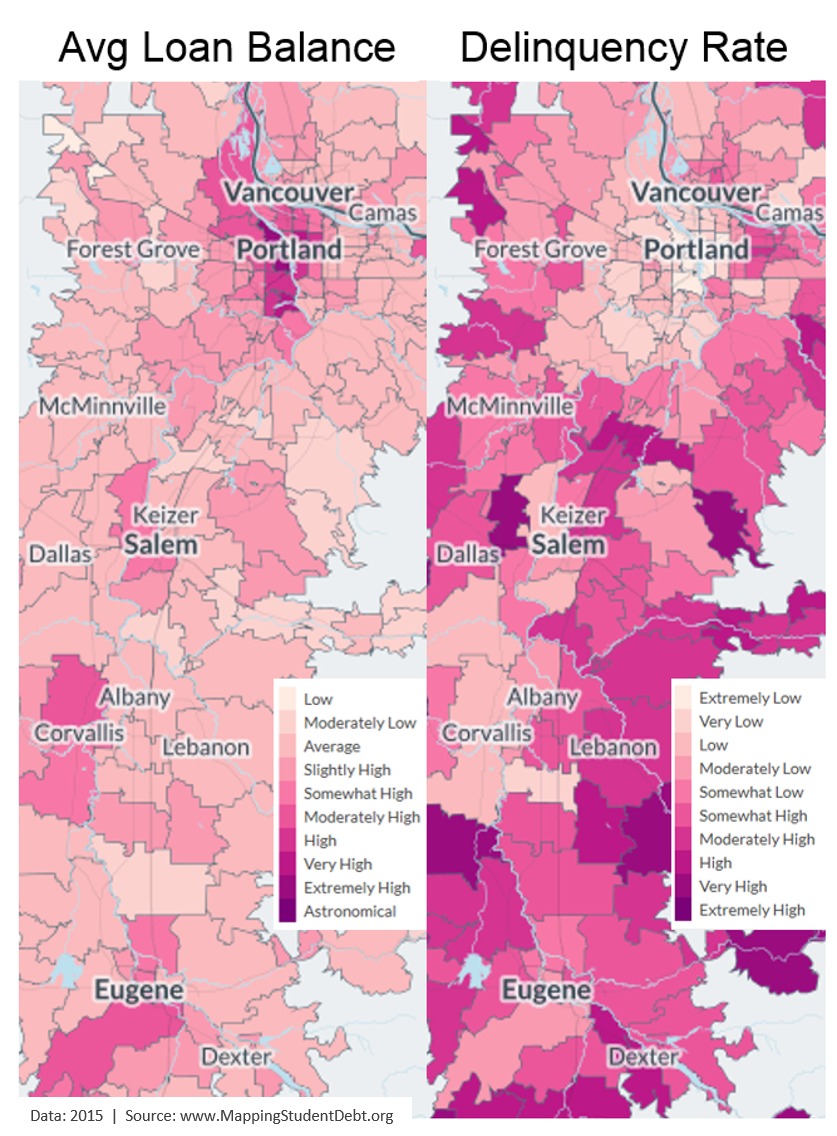
To help drive home this point, I think a visual can help. Taking student loan data from 2015, the folks at MappingStudentDebt.org did just that: they mapped student loan debts. Below you can see the inverse relationship between average student loan balances and delinquency rates across the Willamette Valley. Zip codes with high loan balances have low delinquency rates and zip codes with low loan balances have high delinquency rates.
For more great research on student loans, please see this recent slide deck from the NY Fed. The student loan work starts on slide 16 and runs through the end. Lots of really good information included there, I highly recommend it.


Disclaimer: Articles featured on Oregon Report are the creation, responsibility and opinion of the authoring individual or organization which is featured at the top of every article.