 [5]
[5]
Oregon Recreational Marijuana Forcast
By Josh Lehner
Oregon Office of Economic Analysis [6]
SB 845, among other things, would give our office the recreational marijuana forecast responsibility. While not current law yet, we went ahead and produced such a forecast for the first time in our most recent quarterly forecast. What follows below the fold is an extended summary of our forecast work, including lots of pictures, I mean charts, for those interested.
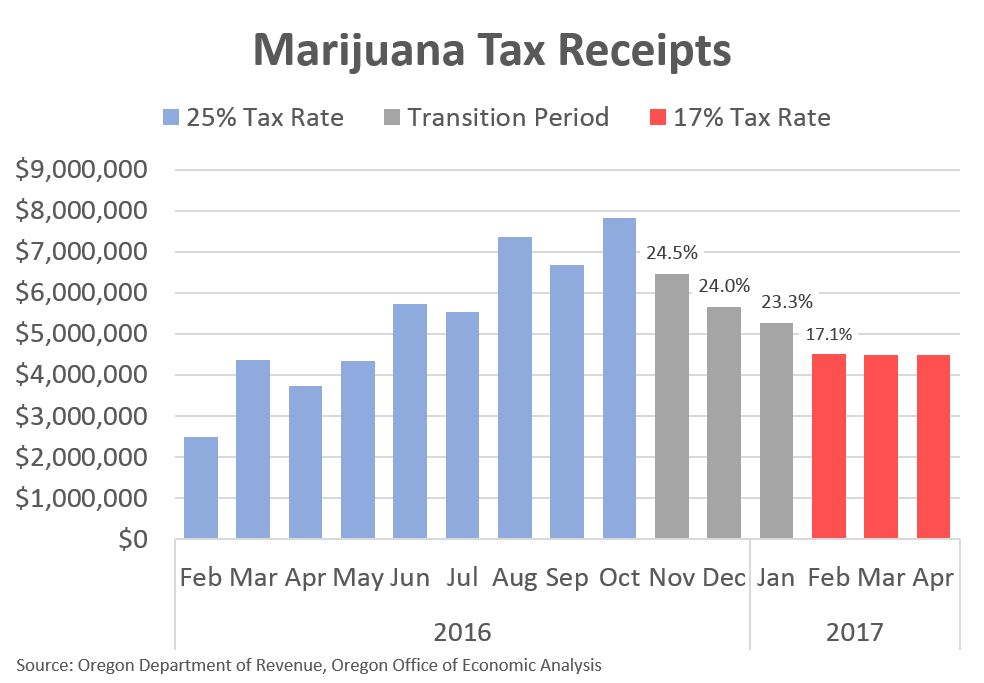
Currently the outlook for recreational marijuana sales and tax collections remains highly uncertain. While Oregon has now collected just over a year’s worth of taxes, there have been substantial changes during this time that complicate any analysis. Early start sales through medical dispensaries were taxed at a 25 percent of rate, while sales at OLCC licensed retailers are now taxed at a 17 percent rate, with the local option of adding up to 3 additional percent. Furthermore, regulatory changes, more stringent product testing requirements, and Mother Nature all impacted and reduced available supply on the market during this time.
The first chart shows monthly tax collections as reported by the Department of Revenue, with the colors representing the different state tax rates. During the transition period there were recreational sales at both medical dispensaries (taxed at 25%) and at OLCC retailers (taxed at 17%). The percentages listed are the effective tax rates after blending together sales under both regimes. These figures do not include any of the local option taxes, just the state portion.
 [7]
[7]
As such, it is challenging to get a handle on the underlying trends in this newly legalized world. Thankfully, Oregon is not alone. Both Colorado and Washington are two years ahead of us. Both states have seen tremendous growth in sales and tax collections, which serves as a guide for where Oregon is likely headed in the near-term. Over time, as the market matures, future growth will follow trends in the economy and consumer spending. However the coming few years will see strong growth as the product becomes more widely available, more socially acceptable, and more black and gray market sales are realized in the legal market.
Certainly, one year’s worth of tax collections, and one set of quarterly tax returns filed by dispensaries is more valuable than no data. Our office’s forecasting responsibilities are made considerably easier than what faced those estimating the potential impact of Measure 91 (2014) which legalized recreational sales. That said, one year’s worth of data is not enough to build a full-fledged forecasting model, particularly when it is a brand new legal market. Over time, as we accumulate more data, a longer history of sales, and detailed breakdowns of consumer purchases and demographics, our office will build an econometric model. Until then, in consultation with our advisory group, and using Colorado and Washington as a guide, our office is relying on trends for the short-term outlook.
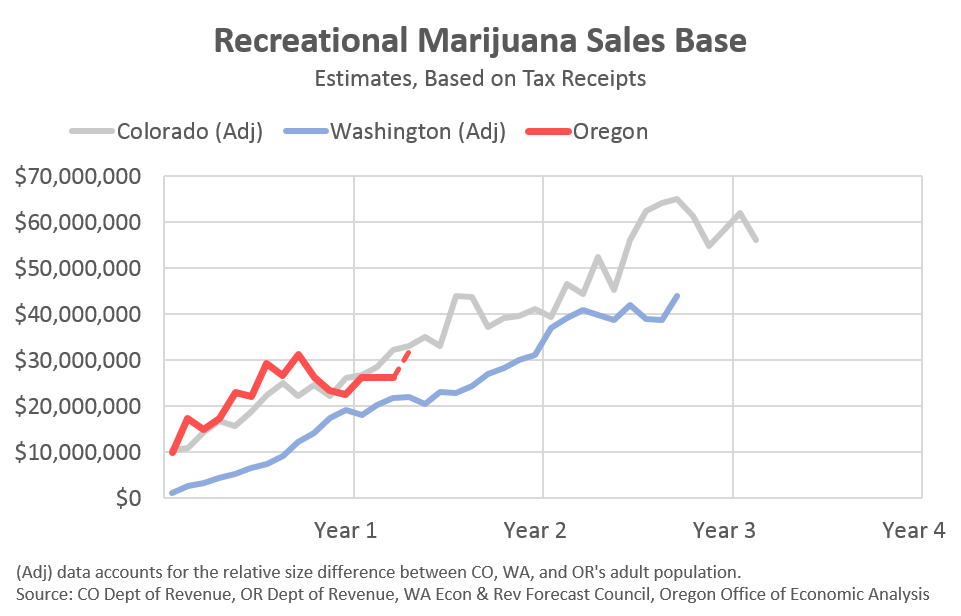
In terms of sales, Oregon’s first year closely tracks Colorado’s first year and outpaces Washington’s. The numbers in the graph below are estimated sales figures based on actual tax collections. Both Colorado and Washington are larger states than Oregon, so we adjust their figures based on the relative size of the adult population.
 [8]
[8]
There are at least four main reasons for this pattern:
First, marijuana usage rates from surveys indicate a larger share of Oregonians have used marijuana in the past month than what is reported in Washington. As such, Oregon is more likely to see larger sales than Washington, after adjusting for population size. However, usage is not the only measure that matters, as Colorado’s usage rates are even higher than Oregon’s. Note that these national health surveys are based on responses prior to recreational legalization.
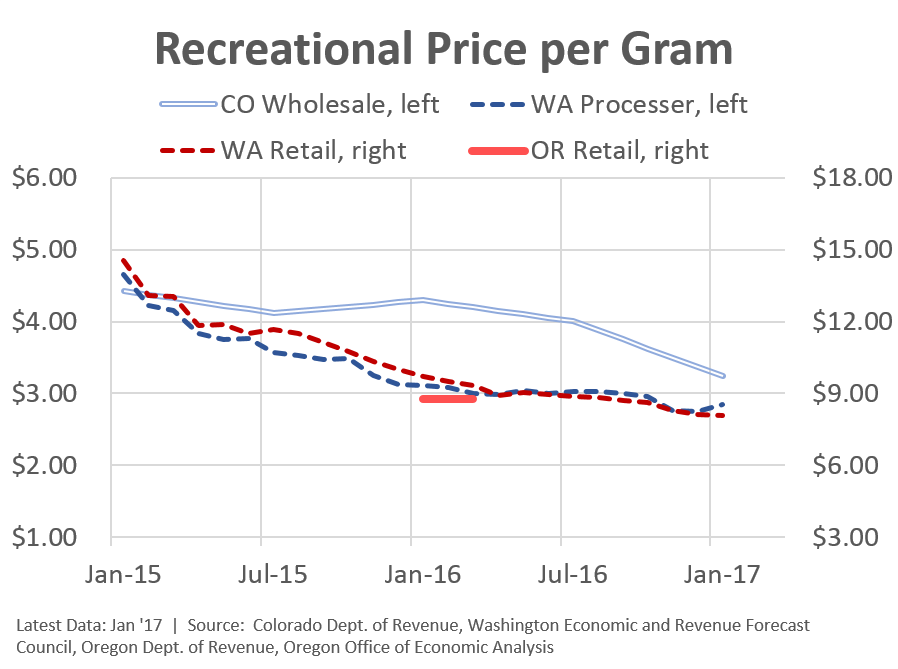
Second, prices and taxes matter. Oregon has a significantly lower tax rate than does Washington, which helps keep final consumer prices lower. Furthermore, the first set of quarterly tax returns, a very limited data set, indicates that Oregon prices were very competitive with Washington prices, even though Washington had two additional years to get accustomed to the newly legal market, license growers, processors and the like. A lower retail price, everything else equal, should bring more consumers and more black market conversions.
Third, the cross-border effect with legal sales beginning earlier in Washington likely had an impact on Oregon’s first year of sales. Counties in southwest Washington saw sales fall by nearly 40 percent once Oregon’s early sales began. Clearly there was plenty of cross-border activity. Effectively this meant Oregon had somewhat of a built-in customer base who were used to purchasing in the legal market. Thus Oregon’s initial sales were larger than in Washington, but this may have some to do with social acceptance and being used to the new system rather than fundamentally stronger sales.
Fourth, both Colorado and Washington initially had relatively few retail outlets in major population centers. In Colorado, Denver had retailers but Boulder did not initially. In Washington, Seattle had only a few retailers at first, but have added quite a few in recent years. As such, some of each state’s strong growth in the first two years was simply due to market access and product availability, particularly in places where lots of people live. It is unlikely this is a similar issue in Oregon, with our major population centers having dispensaries at first, and retailers now. Not that Oregon is overstored, or that there cannot be more room for growth – Colorado, for example, has considerably more retailers even after adjusting for their larger population – however lack of consumer access does not appear to be a major issue in Oregon today for much of the population.
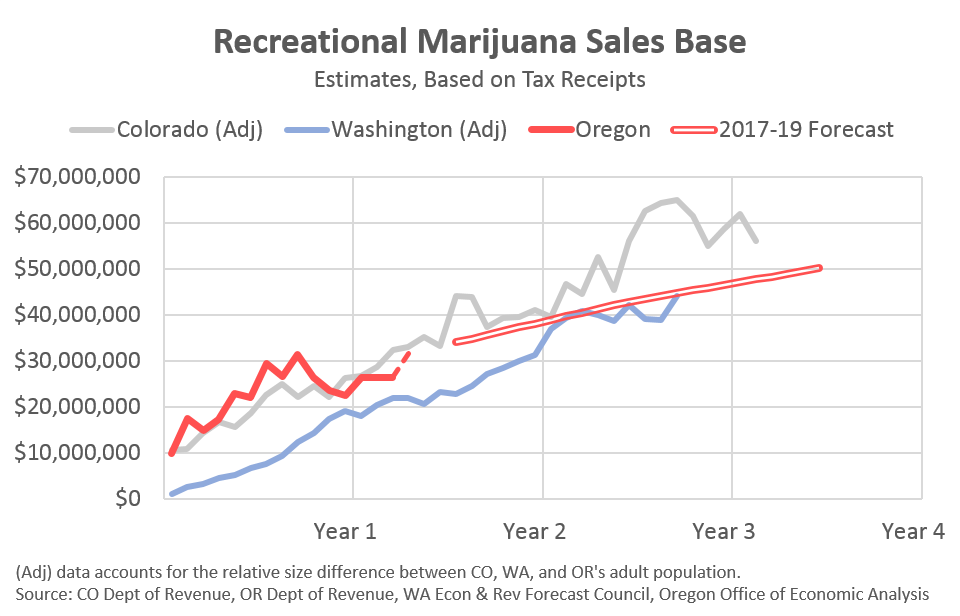
In terms of the outlook, Oregon is poised for strong growth in the coming years. However, given the above and the advice from our advisory group, our office is not forecasting revenues to be quite as strong as those seen in Colorado over their second and third years.
 [9]
[9]
This outlook remains highly uncertain with substantial upside and downside risks.
On the downside, supply constraints that keep products and inventory low will result in fewer sales, and tax collections. Such constraints could be regulatory changes that impact grower, processors or retailers, or regulatory bottlenecks where companies in the industry are unable to get their licenses, renewals or tests completed or approved in a timely manner. Another downside risk for tax collections are prices, given Oregon levies the tax based on the sales price. To date in Colorado and Washington, prices have fallen around 20 percent per year. Marijuana is a commodity and eventually will be commoditized. How far and how quickly prices decline is a considerable risk to the outlook for tax collections. Offsetting this risk somewhat is the fact that lower prices should result in larger sales, helping to buoy tax collections overall, which is what has happened in both Colorado and Washington so far. Finally, the one risk that looms large over the entire forecast is the federal government. While there has been no clear warning or action taken, there is a non-zero chance the federal government could step in and eliminate, or severely restrict recreational marijuana sales. In this event, taxes collected would be considerably less than forecasted.
 [10]
[10]
On the upside, consumers overall could get more comfortable with legalized recreational marijuana sales, and the industry gains broader social acceptance, resulting in larger sales. Furthermore, a faster rate of black market conversion would also result in more legal sales. Similarly, conversions from the medical marijuana market to the recreational market would result in more sales and taxes collections. The impact of the seed-to-sale tracking system may also increase activity within the legal market and restrict the flow of product into the black market.
While the sales and tax collection outlook is uncertain, it is also fairly straightforward. The same cannot be said for distributing the taxes, or at least not yet. Currently there have been no distributions from the collected recreational marijuana taxes and there are likely to be none in the current biennium. Start-up costs to OLCC and other state programs need to be repaid first, with only the net revenues after accounting for these costs available for transfer to recipient programs like schools, state police, city and county law enforcement and the like. The exact reimbursement figures will be finalized in the coming months, with the first tax distributions made early in the 2017-19 biennium.
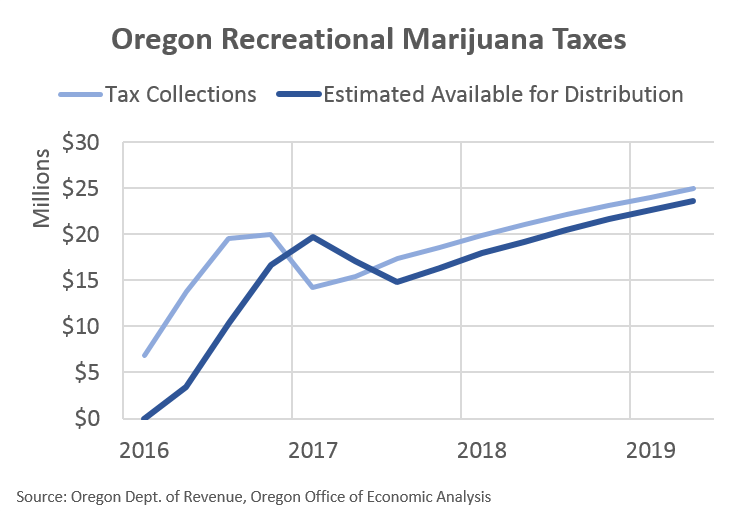
The process and timing for future tax distributions is as follows. First, retailers pay taxes on a monthly basis. These are the figures reported periodically in the media and other outlets. However these taxes are not immediately available for distribution. They only become available for recipient programs once the Department of Revenue has received and processed a retailer’s quarterly tax return. This ensures transfers are made based on the correct, not estimated, taxes paid by retailers. As such there is a time lag of between one and two quarters from when taxes are initially paid to the Department of Revenue and when they are available to transfer to programs. This discrepancy is likely to shorten some in the future as retailers file their taxes in a timelier manner, however the time lag will not be eliminated entirely. The chart below tries to show the lag between the tax collections paid on a monthly basis and when they become available for distribution.
 [11]
[11]
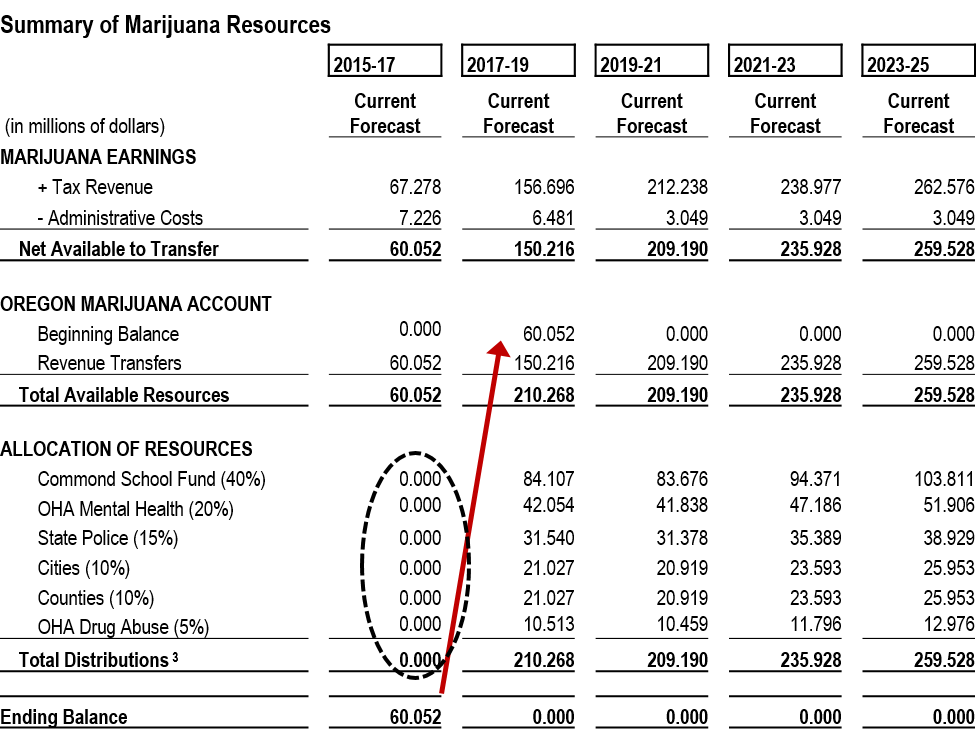
Given no distributions will be made in the current 2015-17 biennium, the accumulated revenues are carried forward into 2017-19 and will be distributed then. Again, note that the Tax Revenues reported in our office’s forecast tables represent the amount available for distribution. Currently there is approximately $78 million in tax collections at the Department of Revenue, with the total 2015-17 figured forecasted to be nearly $90 million. However, as our table shows, under normal circumstances where we do not have to worry about start-up costs being repaid first, only about $67 million of the $90 million would be available for distribution in the 2015-17 biennium. This time lag between monthly collections and quarterly tax returns is a big deal in the budget world and can be a bit confusing. At least for me it was at first when trying to wrap my head around when monies will be distributed.
 [12]
[12]
The above is what our office worked on and published in our latest quarterly forecast. However, some of the costs and revenue distributions will change (or have already changed) based on legislation. For example, the same SB 845 that gives our office the forecasting responsibilities also changes to the revenue distributions. Also, SB 1057 impacts the administrative cost estimates. Additional bills remain alive in the legislative process. Our office, with the help of other agencies and legislative staff, will update the forecast as bills become law. Check back in August when we release our next forecast for all the details.