By Josh Lehner
Oregon Office of Economic Analysis Blog [5]
Average wages in Oregon are picking up as the economy approaches full employment. The graphs below aim to help place these gains in a better historical context. The first chart shows inflation-adjusted wages in Oregon in recent decades. The figures noted in the graph are annual averages from business cycle peak to business cycle peak. They try to answer the question of how much progress has been made over the entire business cycle. 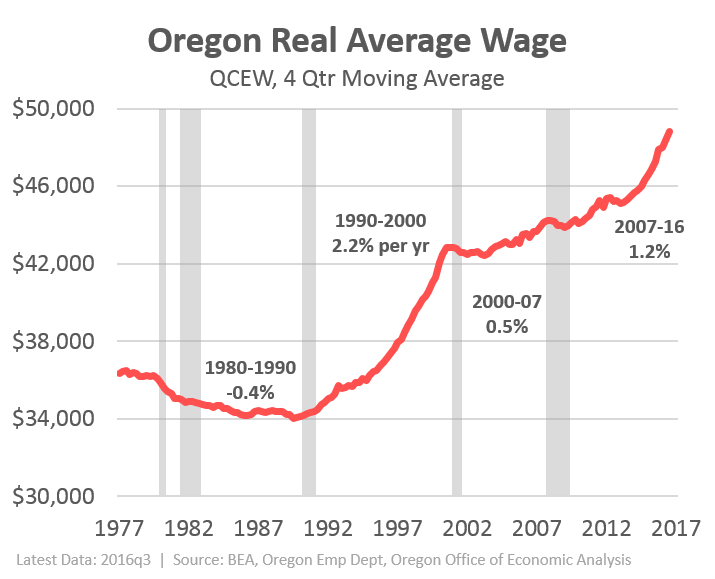 [6]
[6]
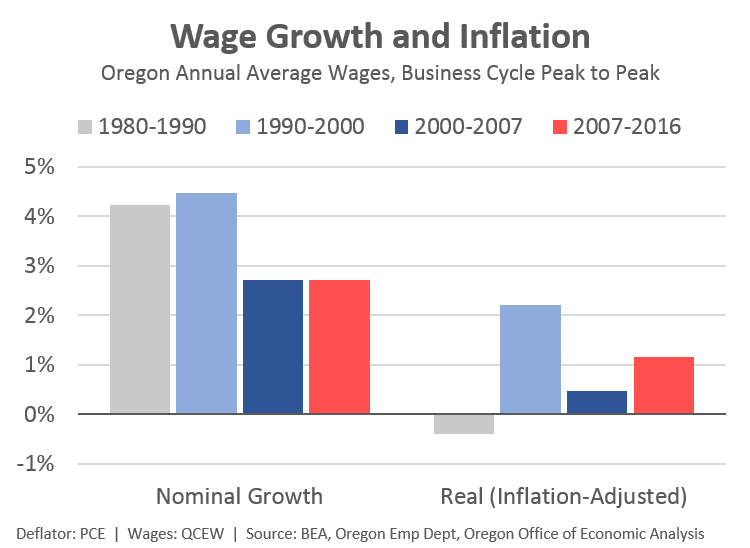
Economists tend to analyze real, or inflation-adjusted gains because they are a marker of overall economic progress. If wages and economic growth are only keeping pace with inflation, then there has been no real progress made in a lot of respects. Yet, even as most people understand this in concept, we tend to focus more on nominal growth when it comes to our wallets since it’s a lot easier to see. All you do is compare your paycheck this year to last year. However the differences between nominal and real gains differ quite a bit over time and have big implications.
Take the 1980s as an example. During that business cycle, average wages in Oregon increased by 4.2% per year, however inflation was increasing by more than that. So on net, or in real terms, average wages in Oregon actually decreased in the 1980s because wage gains did not keep pace with inflation. The 4% gains were nice to have, but the average worker did not come out ahead.
The 1990s were different and in a very good way for the economy (outside of the forest sector [7]). Nominal wage gains were nearly 4.5% per year, significantly outpacing inflation. As such real wage gains were 2.2% per year over the entire business cycle. Note, however, that the eyeball test shows much of those gains came in the second half of the decade. The slope of the line is steeper in the late 1990s than in the early 1990s. As the economy approached, reached and even surpassed full employment, workers saw really strong wage gains.
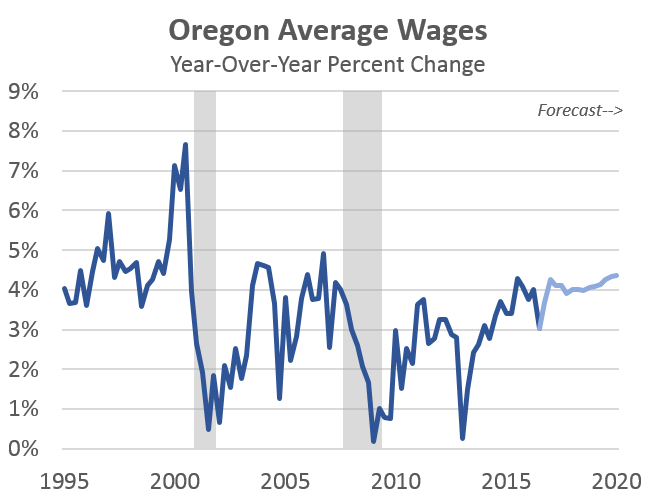
That’s the economic state we’re once again beginning to approach. Oregon overall is at full(ish) employment [8] and an economy where labor is scare behaves differently [9] than an economy digging out from a recession. Now this is not the case in every county or region [10], but statewide and in some of our metro areas it certainly is. See this Bend Bulletin article [11] for example. And given that full employment is much more a concept than a hard calculation, economists look for trends and patterns in the data that show signs of full employment. One key measure is wage growth.
 [12]
[12]
In terms of the outlook, our office expects these conditions to continue in the coming years. The labor market will remain tight. Bargaining power has shifted somewhat back to workers and businesses must compete more on price to attract and retain the best talent. As such, average nominal wage gains are expected to remain around 4% per year, at least until the next recession. In real terms, this works out to around 2% per year as most forecasters expect inflation to be roughly 2% per the Federal Reserve’s stated goal. Note that the data below is BEA income data and differs somewhat from the QCEW data above.
 [13]
[13]
What is expected to change however is job growth. Adding 5,000 jobs per month is unsustainable when the state only needs 2-3,000 jobs per month to keep pace with population. Those gains were needed and welcomed during the recovery, however, the gains have already slowed and are expected to continue to do so. The good news here is that the focus at this point in the business cycle is no longer on how many jobs were added last month, but on the bigger picture and deeper measures of economic well-being. This includes items like median household income [14], poverty rates [15] and even caseloads for needs-based safety net programs.