By Josh Lehner
Oregon Office of Economic Analysis Blog [5]
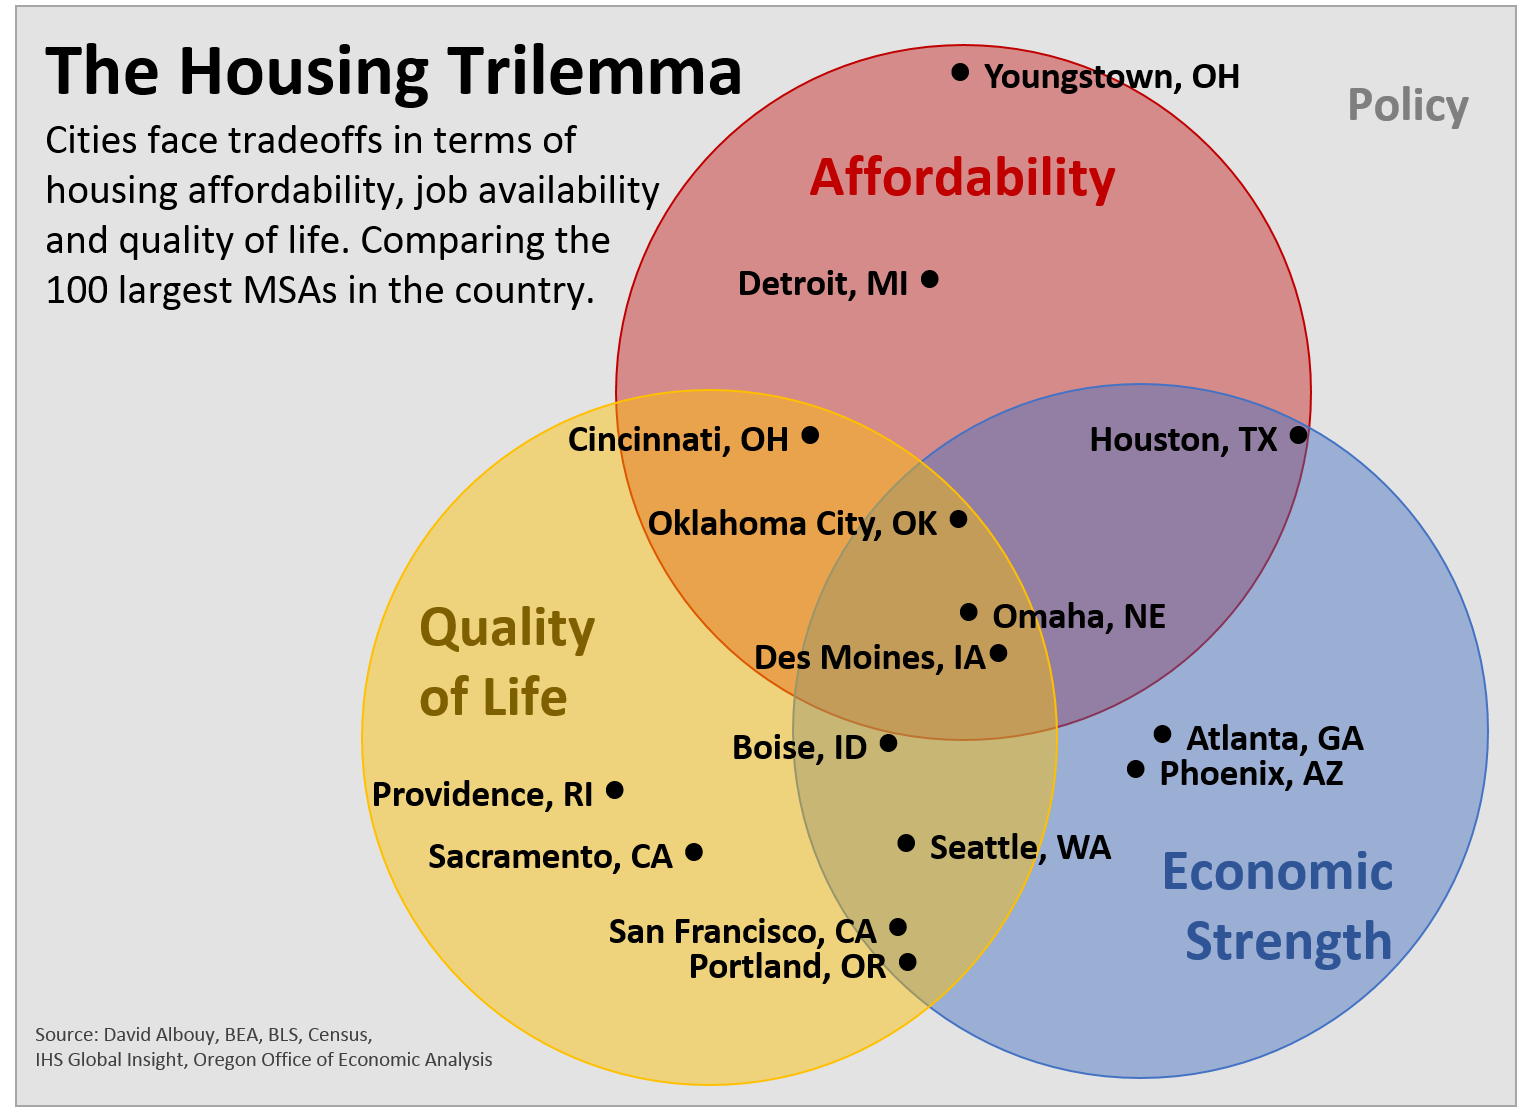
Every city wants to have a strong local economy, high quality of life and housing affordability for its residents. Unfortunately these three dimensions represent the Housing Trilemma. A city can achieve success on two but not all three at the same time. Underlying all of these tradeoffs are local policies as well. Inspired by Kim-Mai Cutler [6] and Cardiff Garcia [7], I set out to try and quantify the Housing Trilemma across the nation’s 100 largest metropolitan areas. It turns out to be very real. Just eight rank among the top half for all three dimensions of the Housing Trilemma. None rank among the Top 20 in all three. Unless you prefer living on the Great Plains, that list of eight metros lacks sizzle*.
Update: All 100 MSAs fall within the Venn diagram below. The metros listed are to show some individual metros that are representative of each part of the diagram. For example, New York City slots in right between San Francisco and Portland. Kansas City is just to the right of Oklahoma City. And so forth. Email me if you would like a version with your metro on it.
 [8]
[8]
The reason these tradeoffs exist is mostly, but not entirely, due to market forces. People want to live in cities with a strong economy and high quality of life. Increased demand for housing leads to higher prices and lower affordability. Nice places to live get their housing costs bid up due to strong demand. The opposite is true as well. Regions with underperforming economies and a lower quality of life do have better affordability.
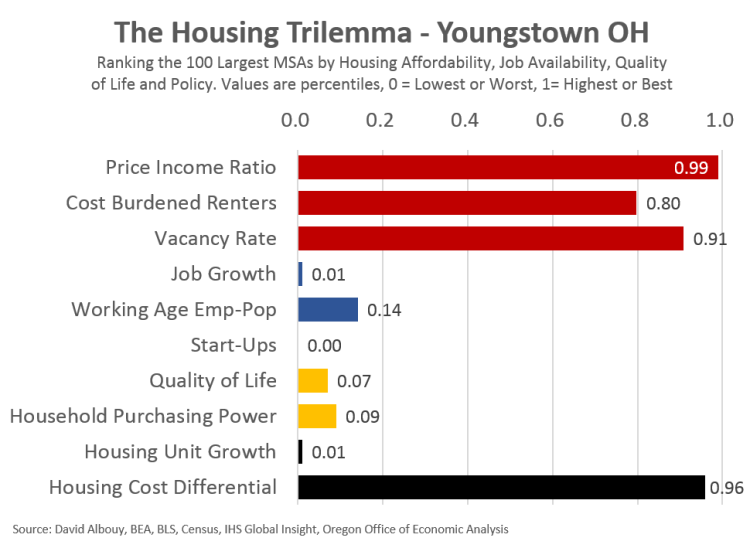
Below are the Housing Trilemma graphs for Portland, Houston and Youngstown to give a few examples of how each city compares to the nation’s 100 largest metros. Note that the bars represent percentiles, or rankings. This is to make the graph easy to read and visually intuitive. The longer the bar, the better a particular metro ranks on that measure. Click here for an interactive version [9]** where you can pick and choose any metro to examine and/or download the data. Go to the “graph” tab and choose a metro from the dropdown menu. Take it for a test drive. The specifics of each metric are shown at the end of the post.
UPDATE: Some are noting issues with the interactive version. Download in Excel here: HousingTrilemma [10]
 [11]
[11] 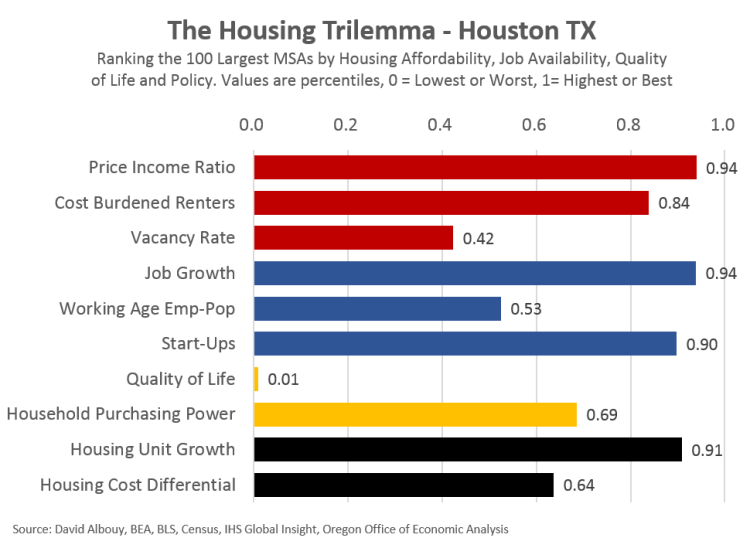
 [9]
[9]
Google Docs Version [9] or Excel Download: HousingTrilemma [10]
Clearly a few patterns emerge. In particular the popular metropolitan areas stand out, not least because their eroding housing affordability is constantly discussed. What you could call the cool city profile is seen in the Denvers, Portlands and San Franciscos of the world. In a way, they are victims of their own success. Their strong regional economy and high quality of life do come as the cost of lower housing affordability.
Yet even among this group, affordability does vary. Portland is an extreme case [12] with significantly more households cost-burdened and a lower vacancy rate than nearly all other metros in the nation. This impacts renters the most, including younger households and those on fixed incomes [13].
For these popular metros, more construction is required, but that alone is not enough. Just look at Austin, TX. The region has a very strong economy and high quality of life. Despite leading the nation’s largest metros in new construction, Austin is only able to reach middling affordability. Austin’s home prices, while lower than Portland’s or Seattle’s, are still relatively high and half of all renters are cost-burdened. Increasing construction is able to help with broad, regional affordability, but cannot fully offset the premium required to live in a popular place. In addition to building more homes, targeted programs are also needed to help less fortunate neighbors bear these costs.
The housing trilemma is real. Tradeoffs are inevitable. Here in Portland and the Northwest more broadly, we are fortunate enough to have a good economy and desirable quality of life. We should work to maintain these successes. However, eroding affordability in Portland does not have to be a permanent trend. Increasing construction to match a growing population and strong assistance programs are needed.
Here are the exact measures used.
 [14]
[14]
* Full disclosure: I am from the Great Plains and many of my relatives still live there. However, my wife likes to joke that it’s a great place to be from. These metros usually don’t knock it out of the park on any particular measure, however they are successful and do rank relatively well when compared to the rest of the nation’s largest metros.
** Apologies for the external dataviz link. Having difficulty embedding the work on our site. Let me know if you have any questions.