![]() [5]
[5]
By Josh Lehner
Oregon Office of Economic Analysis Blog [6]
Traditional analysis and models indicate the economy is essentially at full employment, given the unemployment rate — currently at 5.3% — is in the range of previous estimates of the so-called natural rate, or NAIRU. Historically the Fed, including its models, agrees. However given the severity of the Great Recession, this time really does appear to be different when it comes to labor market slack, at least so far.
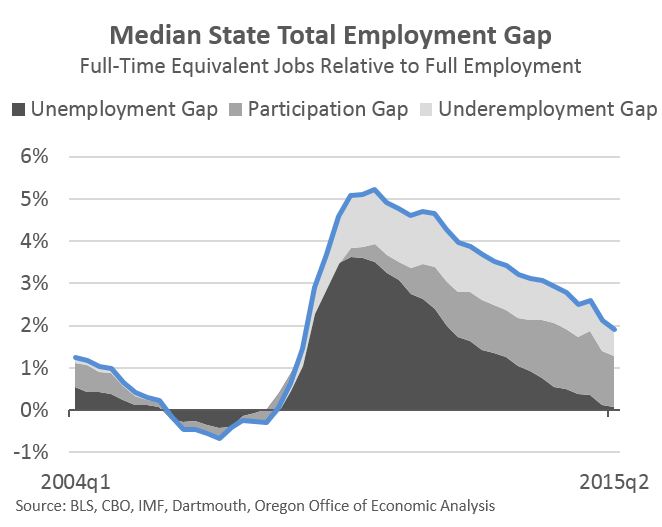
Unfortunately such slack really is an unknown figure but economists keep trying to estimate it. For example, the Federal Reserve created the Labor Market Conditions Index [7] and Tim Duy regularly cites the Yellen Charts [8] highlighting various measures of slack. In this same vein, the Total Employment Gap used by Andrew Levin, previously at the IMF (see HERE [9]), now at Dartmouth (see his latest with co-author Danny Blanchflower [10] for monetary policy implications), is particularly useful and applicable. It incorporates not only the cyclical unemployment gap but also estimates of the labor force participation gap (which takes out the impact of aging) and the underemployment gap (involuntary part-time work), into one easy to use and understand metric. What I have done is use this framework to apply the Total Employment Gap concept to each state over the past decade. Given state level data availability, I took some small liberties with the methodology to ensure compatibility. You can download the methodology and individual state estimates below.
 [11]
[11]
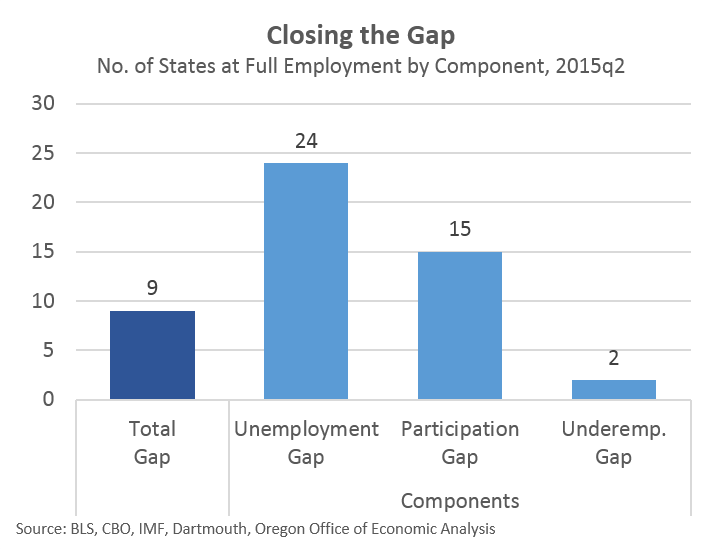
The results show that, like the nation, the typical state today has no cyclical unemployment gap. In 24 of the 50 states, the headline unemployment rate is back down to its full employment rate. However, when examining the Total Employment Gap, just 9 states are at full employment today. Another 10 are within 1 percentage point, but 20 states (40% of all states) remain 2 percentage points or more away. The reason being that there remain large labor force participation gaps and underemployment gaps in most states. Tweaks to the methodology yield similar results, plus or minus a state or two.
 [12]
[12]
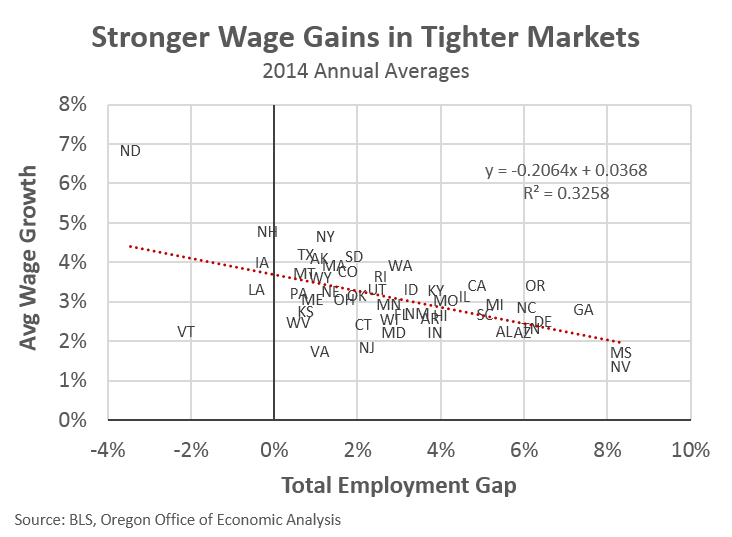
Finally, the Total Employment Gap may shed some additional light on wage gains, or lack thereof, across the country. There is a highly significant relationship between a state’s total employment gap and its wage gains in 2014 (t-stat of -4.84, looking at QCEW average wages, not hourly earnings data.) The explanatory power may not be extremely large, however the total employment gap is a better fit than using the unemployment rate alone. As such, the evidence does line up with the theory that in tighter labor markets firms must compete more on price (wages) to attract and retain the best workers. These findings hold up in recent year as well (2012 and 2013.)
 [13]
[13]
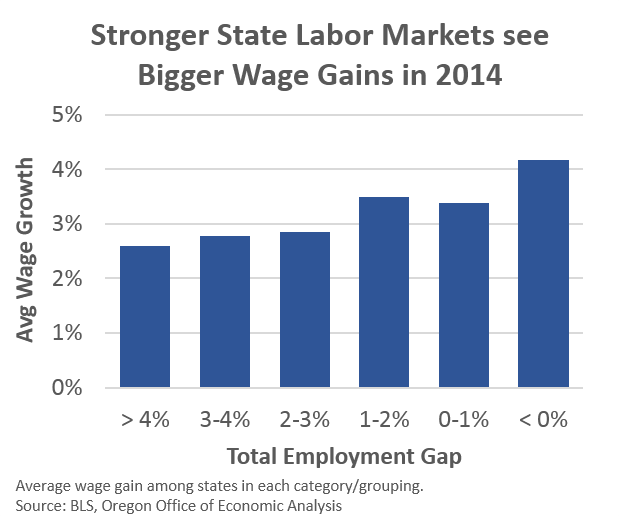
Such scatter plots and regressions, while good for analysis, can be messy. A more visually appealing version of the same data is shown below; it groups the states by their total employment gap in 2014 and averages their wage gains within each group.
 [14]
[14]
Overall, progress is being made across the country, no question. As the labor market continues to improve, stronger wage gains will come. Even if some of us were fooled by the ECI recently. However just a handful of individual state labor markets can be considered at full employment today. More than twice as many are at least 2 percentage points away. Most encouraging (at least through the latest BLS benchmark), the labor force participation rate was seeing substantial gains in some of the hardest hit states. Oregon is one such state [15] and while our economy has never had more jobs overall and our unemployment rate is back down to 5.5%, our office’s forecast calls for the Total Employment Gap to be eliminated only by mid-2017 [16], or some 9 years after the onset of the Great Recession.
Download the methodology and individual state Total Employment Gap estimates. State Employment Gap 2015 [17] (PDF)