 [5]By Economist Dr. Eric Fruits, Econinternational [6]
Results from the Business Roundtable’s [7] first quarter 2014 CEO Economic Outlook Survey [8] show a moderate uptick in CEO expectations for hiring, sales and capital expenditures and some improvement in the Business Roundtable CEO Economic Outlook Index.
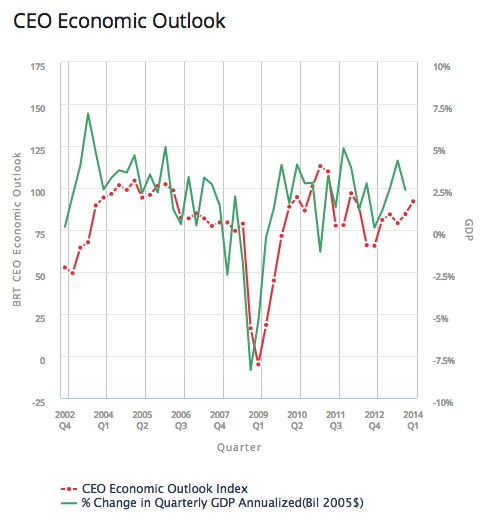
The first graph in the press release shows the CEO Economic Outlook Index and changes to US GDP plotted as a time series.
 [9]
[9]
With a simple eyeballing, things look pretty good in that the ups and downs of both lines seem to line up.
This raises the big question: Are CEOs good forecasters?
The Business Roundtable CEO Economic Outlook Index is a composite index of CEO expectations for the next six months of sales, capital spending, and employment. The Business Roundtable says their index is a good predictor of where the economy is going:
In March 2011, Steve Leisman, Senior Economics Reporter for CNBC, showed that the index was an accurate tracker of real GDP. … A study in 2013 showed that the change in the index provides a statistically significant leading signal of the change in U.S. GDP.
Notice the careful wording. Mr. Leisman said that the index was an accurate tracker of real GDP. In other words, it accurately reflects how the economy is currently performing.
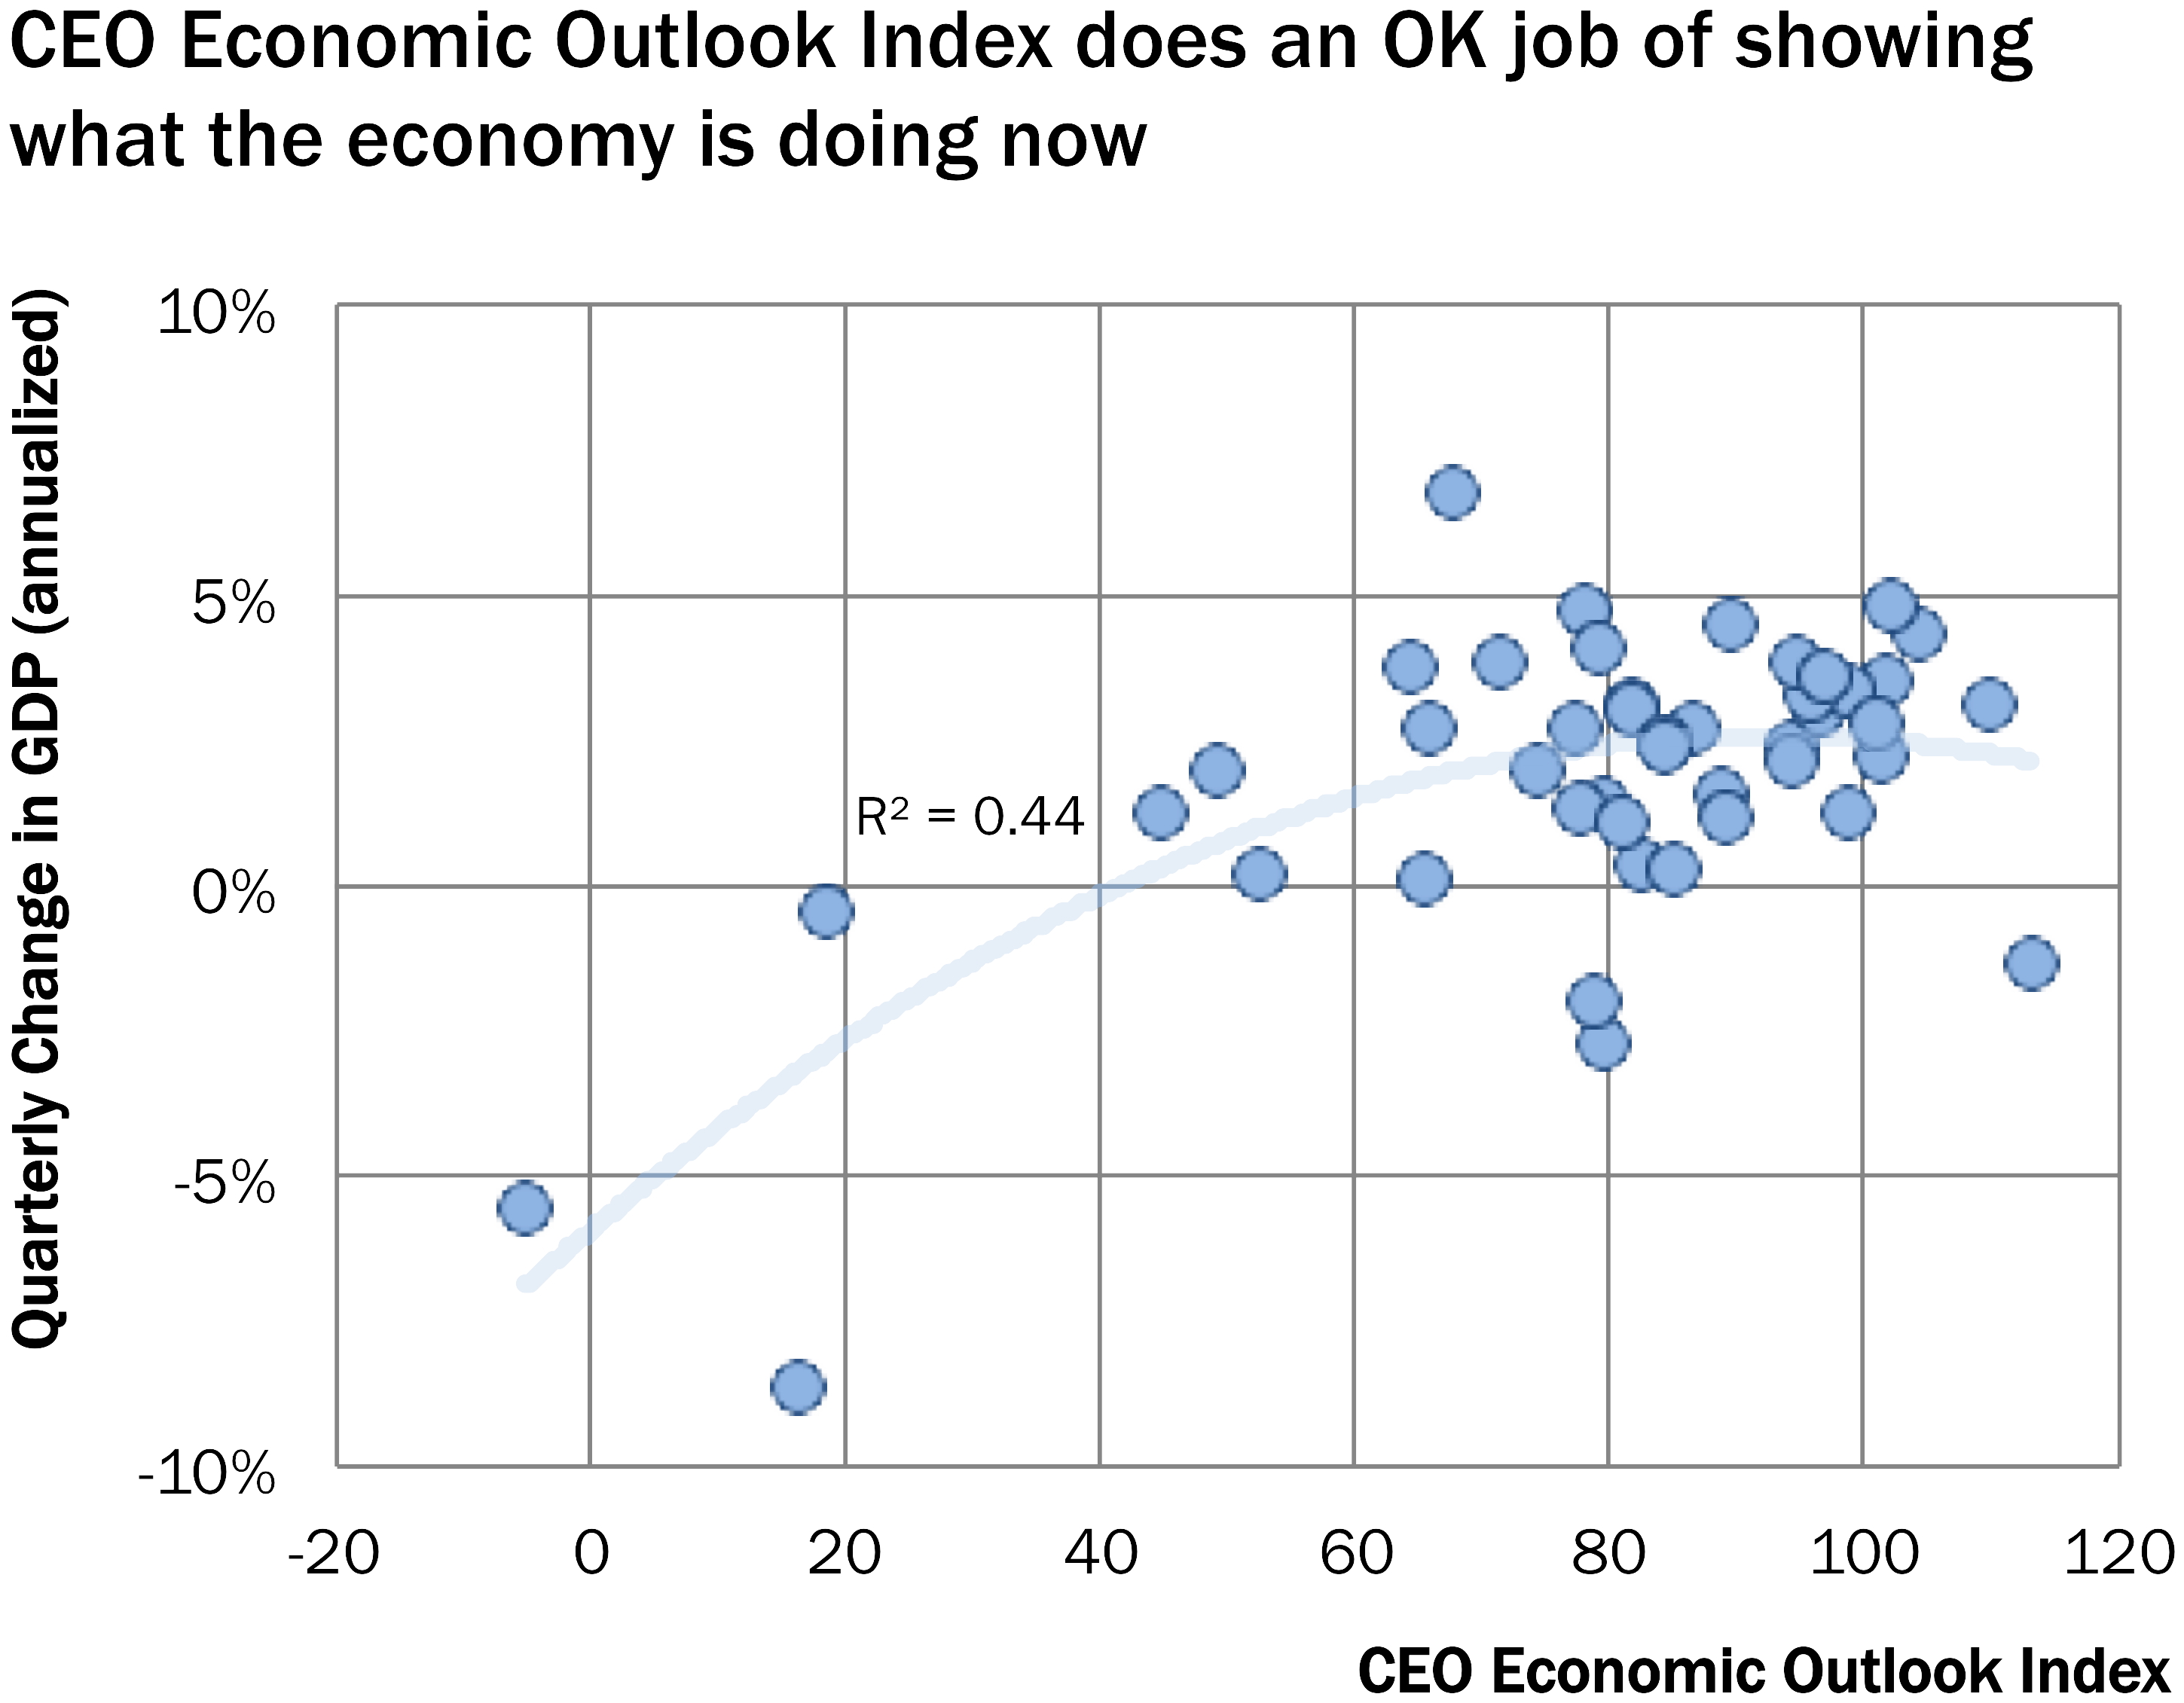
Let’s take the figure above and make one simple change. Instead of a quarterly time series, we’ll turn it into a scatterplot, where the index is on the X axis and the change in GDP is on the Y axis.
 [10]
[10]
Things look pretty good: A bigger index is associated with a bigger increase in GDP. The upward slope says that an increase in the index is generally associated with a more rapid increase in GDP.
The R-squared goodness-of-fit measure is OK, with 44 percent of the variation in GDP explained by variation in the index.
Predicting the past
There’s an old joke that forecasting the economy is like trying to drive car looking only in the rear view mirror. Economists do a great job of saying where we’ve been, but have a hard time of saying where we’re going. In that sense the CEOs surveyed by the Business Roundtable do a great job of saying where the economy has been.
Let’s make one more change to the scatter plot. In the figure below, the index is on the X axis and last month’s change in GDP is on the Y axis.
[10]
In other words, CEOs do a great job of saying where we’ve been. If GDP increased last quarter, CEOs are likely to provide a better assessment for the index. (By the way, see what I did there with causation?)
The R-squared goodness-of-fit measure is pretty good, with 64 percent of the variation in GDP explained by variation in the index.
Forecasting the future
However, this is similar to the lost traveler who pulls over to ask a local where he is, only to have the local answer, “You’re in a car.” While it may be true, it not especially helpful.
So, let’s see how helpful the index is in forecasting where the economy is going.
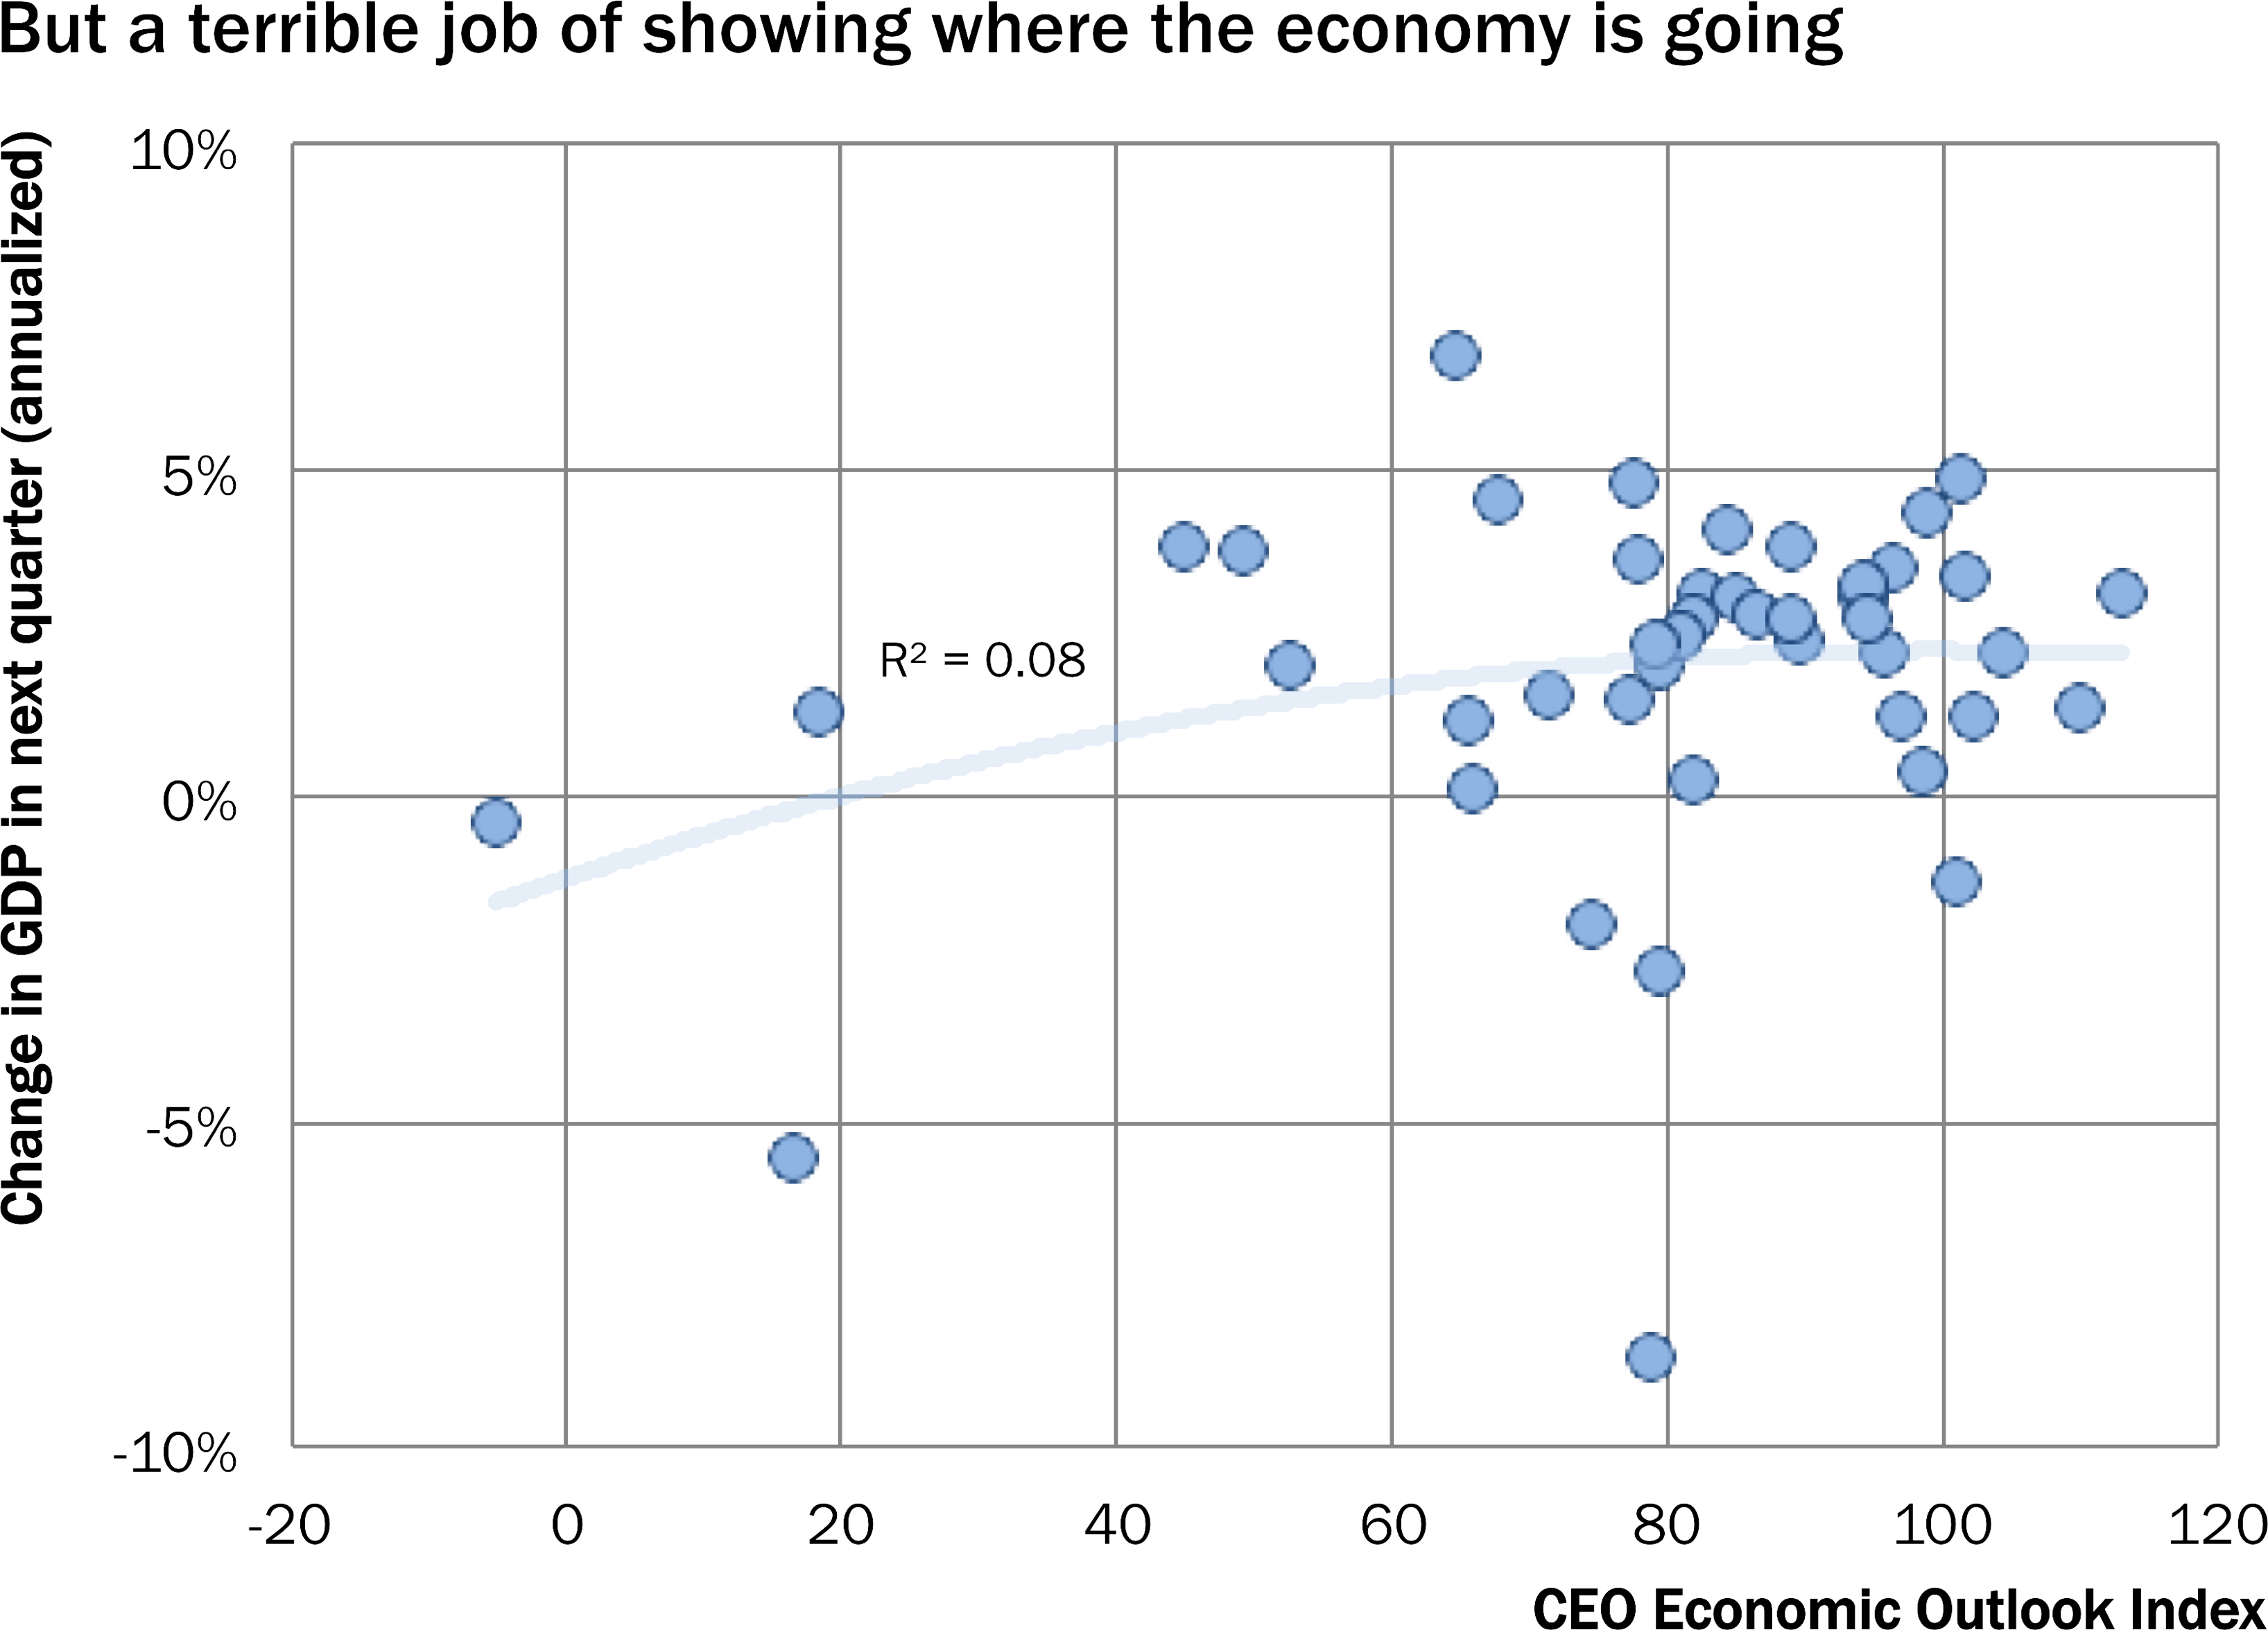
That means one more change to the scatter plot. In the figure below, the index is on the X axis and the change in GDP one month forward is on the Y axis.
 [11]
[11]
Now things get a bit catawampus. Notice that the dots are all over the place. For example, an index of 80 is associated with growth of almost 5 percent or shrinkage of more than 8 percent.
The R-squared goodness-of-fit measure is not so hot, with 8 percent of the variation in GDP explained by variation in the index. If you use the index to forecast GDP growth, you’re not doing much better than guessing.
One more try
I know what you’re thinking at this point. The quote above says that a study in 2013 showed that the change in the index provides a statistically significant leading signal of the change in U.S. GDP.
That means one last change to the scatter plot. In the figure below, the month-over-month percent change in the index is on the X axis and the change in GDP one month forward is on the Y axis.
 [12]
[12]
The goodness-of-fit is a bit better, but things still look catawampus—and that’s after throwing out two outliers that made the chart go kablooey. Notice that the dots again are all over the place, but mostly clustered around zero on the X axis. For example, GDP growth of 4 percent is associated with 143 percent increase in the index, a 24 percent increase, a 2 percent increase, and a 6 percent decrease in the index.
Economic forecasting is challenging in a stable economy, and the Business Roundtable is commended for collecting CEOs assessments of the economy. While the CEO Economic Outlook Index may not be especially useful in forecasting the economy, the survey provides valuable information about what companies themselves are planning to do in the near future:
- Nearly half of CEOs said they expect to boost US capital spending in the next six months, compared with only 39 percent expecting higher spending three months ago.
- 72% of CEOs see an increase in sales in the next six months
- Only 37 percent expect to boost U.S. employment while 44 percent see their US payrolls unchanged.