By Phoebe Colman
Oregon Employment Department [6],
Discussions about job creation in the U.S. economy often focus on the relative importance of small versus large businesses as engines of economic growth. More recently, this conversation broadened to include questions about the dynamics of young businesses and the importance of business age in understanding job creation. This article explores the role of young business establishments in Oregon’s private sector, focusing on changes in birth patterns, survival rates, and employment growth during periods of recession [7].
Data on the age and survival rates of Oregon businesses come from the Business Employment Dynamics (BED) program of the U.S. Bureau of Labor Statistics [8]. BED age and survival data measure over-the-year employment change in private-sector establishments from March of each year. The age of an establishment is determined by its date of first positive employment. A single business may operate at one establishment or multiple establishments. For this reason, an establishment birth can represent either the start-up of a new business or the expansion of an existing one.
To understand the importance of young establishments in Oregon’s labor market, we might first want to know how many of them exist, and how many jobs they represent. In March 2011, establishments that were five years old or younger accounted for 32.4 percent of the total number of establishments and 13.3 percent of private employment in Oregon (Table 1 [9]). Establishments born between March 2010 and March 2011 represented 8.0 percent of the total number of establishments and 2.3 percent of employment. By contrast, about two-thirds of all private-sector establishments were more than five years old. These older establishments accounted for 86.7 percent of private employment in Oregon.
These observations suggest that surviving establishments tend to grow over time. In March 2011, establishments that were less than one year old had an average of 3.6 employees, while those that were 1 to 5 years old averaged 5.8 employees each. Establishments that were 6 to 10 years old had 9.8 employees each, and the average size of the oldest establishments was 18.6 employees.
Comparing these distributions with figures from March 2007, before the onset of the last recession, it appears that younger establishments played a more prominent role prior to the recession. In other words, there were more young establishments in 2007, and they employed a larger share of the private-sector workforce [10] than in 2011. The average number of employees per establishment was also larger for all age groups in 2007.
How can we explain these changes? Birth trends and survival rates are two major factors that affect establishment age distributions. How many establishments are born each year and how many jobs are created from these births? How long do new establishments survive and how much do they grow?
| Oregon Private-SectorEstablishments by Age | |||||
| March 2007 | March 2011 | ||||
| Age | Number | Percent of Total | Number | Percent of Total | |
| <1 year | 10,116 | 9.5% | 8,119 | 8.0% | |
| 1-5 years | 29,239 | 27.6% | 24,779 | 24.4% | |
| 6-10 years | 19,364 | 18.3% | 17,214 | 16.9% | |
| 11+ years | 47,283 | 44.6% | 51,558 | 50.7% | |
| Total | 106,002 | 101,670 | |||
| Oregon Private-SectorEmployment by Establishment Age | |||||
| March 2007 | March 2011 | ||||
| Age | Jobs | Percent of Total | Jobs | Percent of Total | |
| <1 year | 38,491 | 2.7% | 29,375 | 2.3% | |
| 1-5 years | 205,599 | 14.4% | 142,766 | 11.0% | |
| 6-10 years | 225,252 | 15.8% | 169,349 | 13.0% | |
| 11+ years | 955,525 | 67.1% | 958,259 | 73.7% | |
| Total | 1,424,867 | 1,299,749 | |||
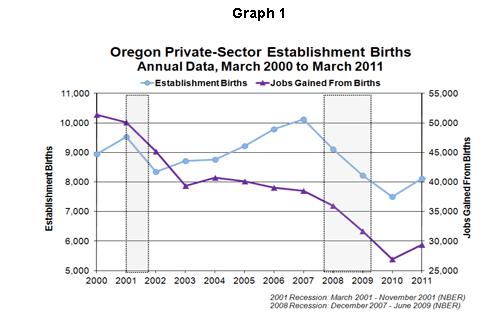
Since about 2000, the number of establishment births in a given year tended to decrease during recessions and to increase during non-recessionary periods (Graph 1 [11]). On the other hand, the total number of jobs gained from births decreased markedly, even during periods when the number of births increased. In 2000, new establishments began with an average of 5.7 employees. By 2007, when the number of establishment births was at its height, there were 3.8 jobs gained for each establishment opening.
Declines in both series are sharpest during recessions. The period from March 2009 to March 2010 included the final months of the Great Recession and marks a record low for both the number of establishment births and the number of jobs gained from births over the span of the data series. In March 2010, there were 3.6 jobs gained for each establishment birth. The next year showed a very slight increase that still rounds to 3.6 jobs.
Significant decreases in both the number of establishment births and the number of jobs gained from these births partially explain why older establishments are more prominent in Oregon’s private sector in 2011 than they were in 2007. Survival statistics can offer further insights into the dynamics of young establishments and their prospects during periods of recession.
Young businesses exhibit a characteristic “up or out” growth pattern, as described in the National Bureau of Economic Research’s August 2010 working paper titled Who Creates Jobs? Small vs. Large vs. Young. Each year, new businesses create a substantial number of jobs. Many of these startups fail in the first few years, destroying any jobs they created. Businesses that survive tend to grow quickly in their early years.
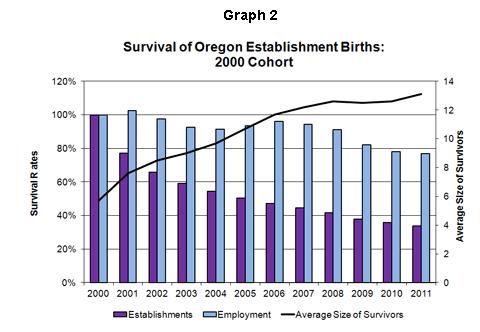
This “up or out” dynamic can be seen in survival rates for the cohort of Oregon establishments born between March 1999 and March 2000 (Graph 2 [12]). One year after they opened, 77.2 percent of these establishments were still in business, meaning that nearly one quarter of them failed in the first year. Another 11.5 percent closed the next year, and 6.5 percent the year after that. Establishment failures are a normal occurrence in any year, but they are much more common in a cohort’s first few years.
Employment patterns also reflect an “up or out” dynamic. In Graph 2, the bars labeled “Employment” represent levels at the surviving establishments as a percent of the cohort’s initial employment. The line labeled “Average Size of Survivors” is calculated by dividing cohort employment levels by the number of surviving establishments. For the 2000 cohort, the average size of surviving establishments is increasing over time. Although some jobs are lost due to establishment failures, these losses are offset by employment growth at surviving establishments. Businesses in this cohort opened with an average of about 6 employees. By March 2006, surviving establishments had doubled this to an average of about 12 employees.
The U.S. experienced two recessions in the past 10 years, the first from March to November 2001 and the most recent from December 2007 to June 2009. How did these events affect the survival and growth of young business establishments in Oregon?
Table 2 [14] presents survival rates for cohorts of establishments in their first three years after opening. Reference periods highlighted with bold print coincide with periods of recession. For example, “March 2001” is not highlighted in the first column of Table 2 because this cohort includes establishments born between March 2000 and March 2001, before the onset of the 2001 recession. However, this cohort’s one-year survival rate is highlighted because it was measured from March 2001 to March 2002, during and immediately following the recession.
On average, survival rates during recessions are 4 to 5 percentage points lower than comparable survival rates in non-recessionary periods. The relatively moderate 2001 recession had its largest effect on the survival rates of establishments born between March 2000 and March 2001, just before the recession actually began. Establishments born during that recession had survival rates on a par with non-recessionary averages.
In the case of the Great Recession, it is more difficult to say definitively which cohort suffered the most. This is partly because we do not yet have enough data to discern long-term trends for cohorts born in the last few years. It is also because this downturn lasted through multiple reference periods, and hit different cohorts at different stages in their early development. The 2006 and 2008 cohorts are a good example of this. These two groups of establishments both have a three-year survival rate of about 54 percent, but their survival patterns in their first two years are quite different.
The 2006 cohort has a one-year survival rate of 79.5 percent, slightly higher than the non-recessionary average. This cohort’s two-year survival rate coincides with the onset of the recession, and is slightly below the non-recessionary average. While it is common for a cohort to lose about 20 percent of its original establishments by the end of the first year and another 10 percent by the end of the second year, the 2006 cohort lost 13.3 percent in its second year. This group also lost 12.1 percent of its original establishments between the second and third year, compared to a normal rate of 6 to eight percent. Having fared well initially, this cohort’s three-year survival rate is below the recessionary average and among the lowest in the series.
The 2008 cohort’s first full year of operations occurred during the critical March 2008 to March 2009 reference period, right in the middle of the Great Recession. This cohort’s one-year survival rate of 70.8 percent is the lowest in the series. Although this group lost almost 30 percent of its original establishments by the end of the first year, its additional losses in the second and third years were 10.4 and 6.7 percent respectively. By this measure, establishments in the 2008 cohort that survived their first turbulent year were no more likely to fail in a subsequent year than those born in non-recessionary periods.
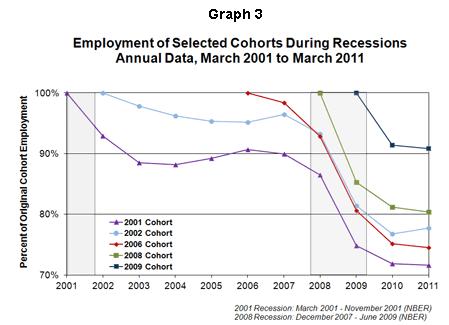
Employment of young establishments during recessions follows a pattern similar to survival rates (Graph 3 [15]). Employment dropped sharply for all cohorts during the Great Recession, and then stabilized as the recession ended and recovery began. For the 2008 cohort, the depths of the recession coincided with the first full year of operations, when this group likely would have experienced significant closures and job destruction even in a non-recessionary period. On the other hand, the 2006 cohort experienced its most critical “up or out” years before the recession began, then suffered a new shock just as establishment closures and job destruction would have normally been expected to level off.
The role of young businesses continues to be evaluated as a factor in understanding job creation in the U.S. economy. In Oregon, the Great Recession appears to have reduced establishment birth and survival rates and inhibited employment growth among young establishments. New establishments are also opening with fewer employees, a trend that has persisted for at least the last decade. As a result, younger establishments have a less prominent role in Oregon’s private sector in 2011 than they did before the recession.
For more information about BED age and survival data, please see www.bls.gov/bdm [16].
| Survival Rates of New Establishments:First Three Years | |||
| Annual BirthsYear Ended: | Percent Surviving | ||
| 1 year | 2 years | 3 years | |
| March 2000 | 77.2% | 65.7% | 59.2% |
| March 2001 | 73.1% | 63.7% | 57.5% |
| March 2002 | 78.7% | 68.7% | 62.3% |
| March 2003 | 78.9% | 69.1% | 62.3% |
| March 2004 | 79.3% | 69.6% | 63.7% |
| March 2005 | 79.7% | 70.5% | 61.2% |
| March 2006 | 79.5% | 66.2% | 54.1% |
| March 2007 | 75.4% | 59.6% | 51.5% |
| March 2008 | 70.8% | 60.4% | 53.7% |
| March 2009 | 75.4% | 64.5% | – |
| March 2010 | 76.8% | – | – |
| Average (baseline) | 78.6% | 67.7% | 59.8% |
| Average (recession) | 73.7% | 63.0% | 55.6% |


